As the bulls finally seemed to stall the sell-off situation, the crypto market found itself wavering into the green zone over the past day. Accordingly, Polkadot crossed its 20/50 SMA while reclaiming the $26.1-support.
Uniswap and EOS saw a patterned breakout above their 20-SMA’s after flashing bullish 4-hour RSIs. However, they struggled to exhibit a flawless rally by failing to ramp up the volumes.
Polkadot (DOT)
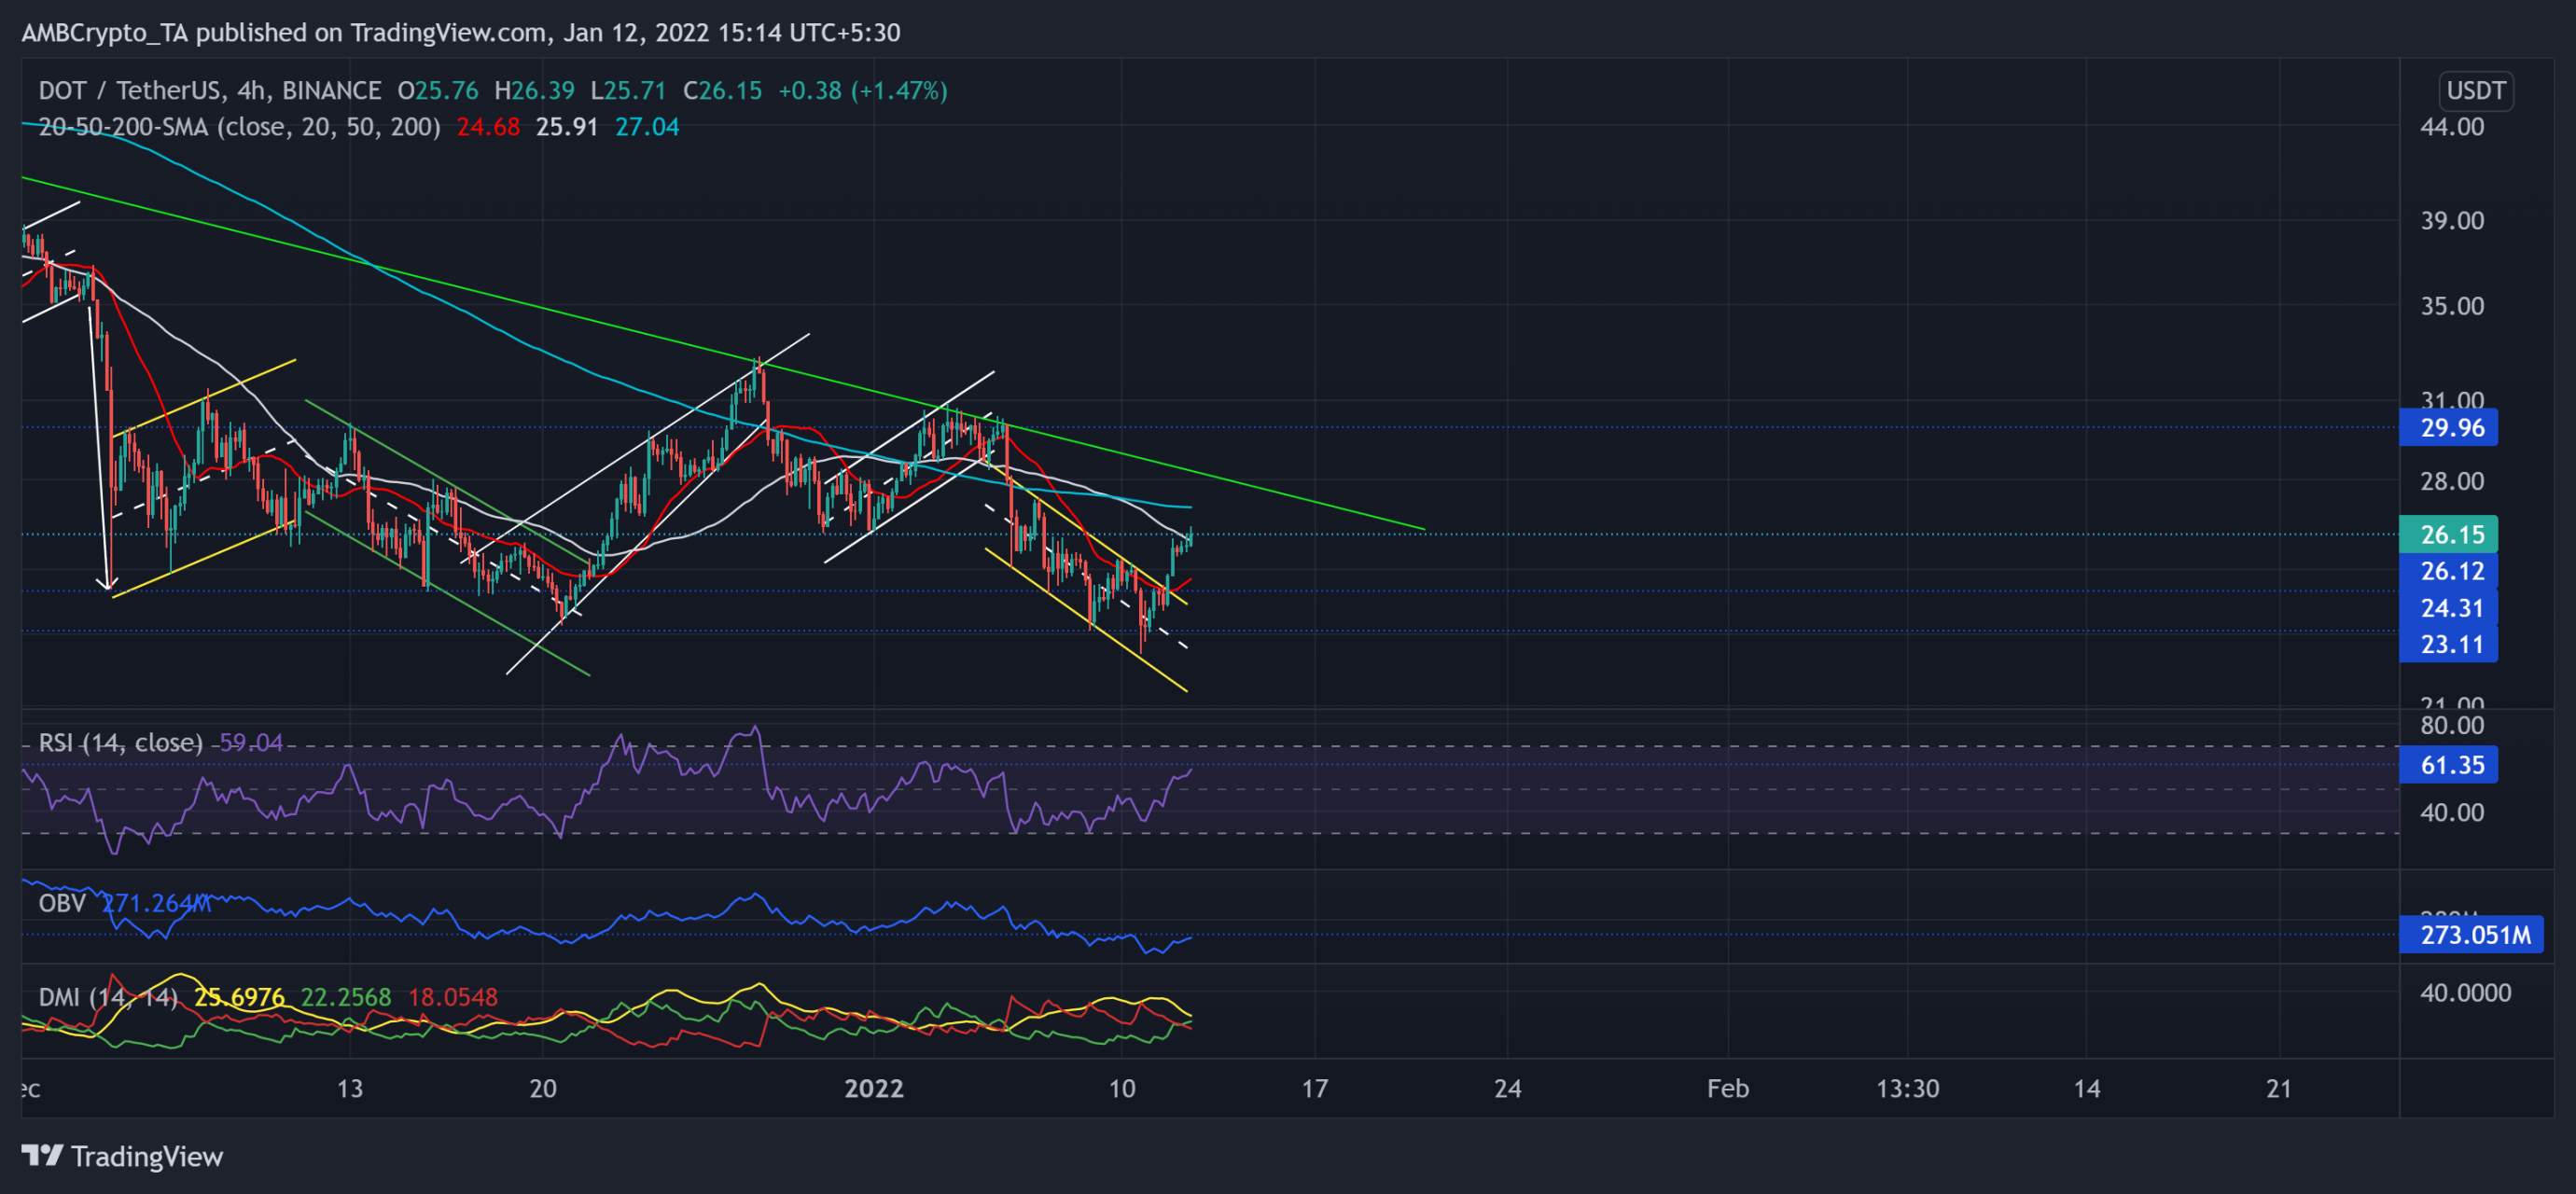
TradingView, DOT/USDT
DOT saw a likely upturn after the price tested the $23.11-mark five-month support again on 11 January. As a result, the alt saw a whopping 17.95% ROI (from 10 January low) until press time. These gains pushed DOT above its 4-hour 20-50 SMA as it reclaimed the $26.1-mark lost support.
Nevertheless, the alt still marked lower peaks on its bearish trendline (green) for the past two months. Now, the alt eyed to retest its 200 SMA (cyan). But it will need more muscle to sustain a close above the current level as the OBV could not even rise to its previous level at the same price point.
At press time, DOT traded at $26.15 after noting a 10.61% 24-hour gain. The RSI looked North as it endeavored to cross the 61-mark resistance. The recent bullish crossover of the DMI lines suggested increased buying influence.
Uniswap (UNI)
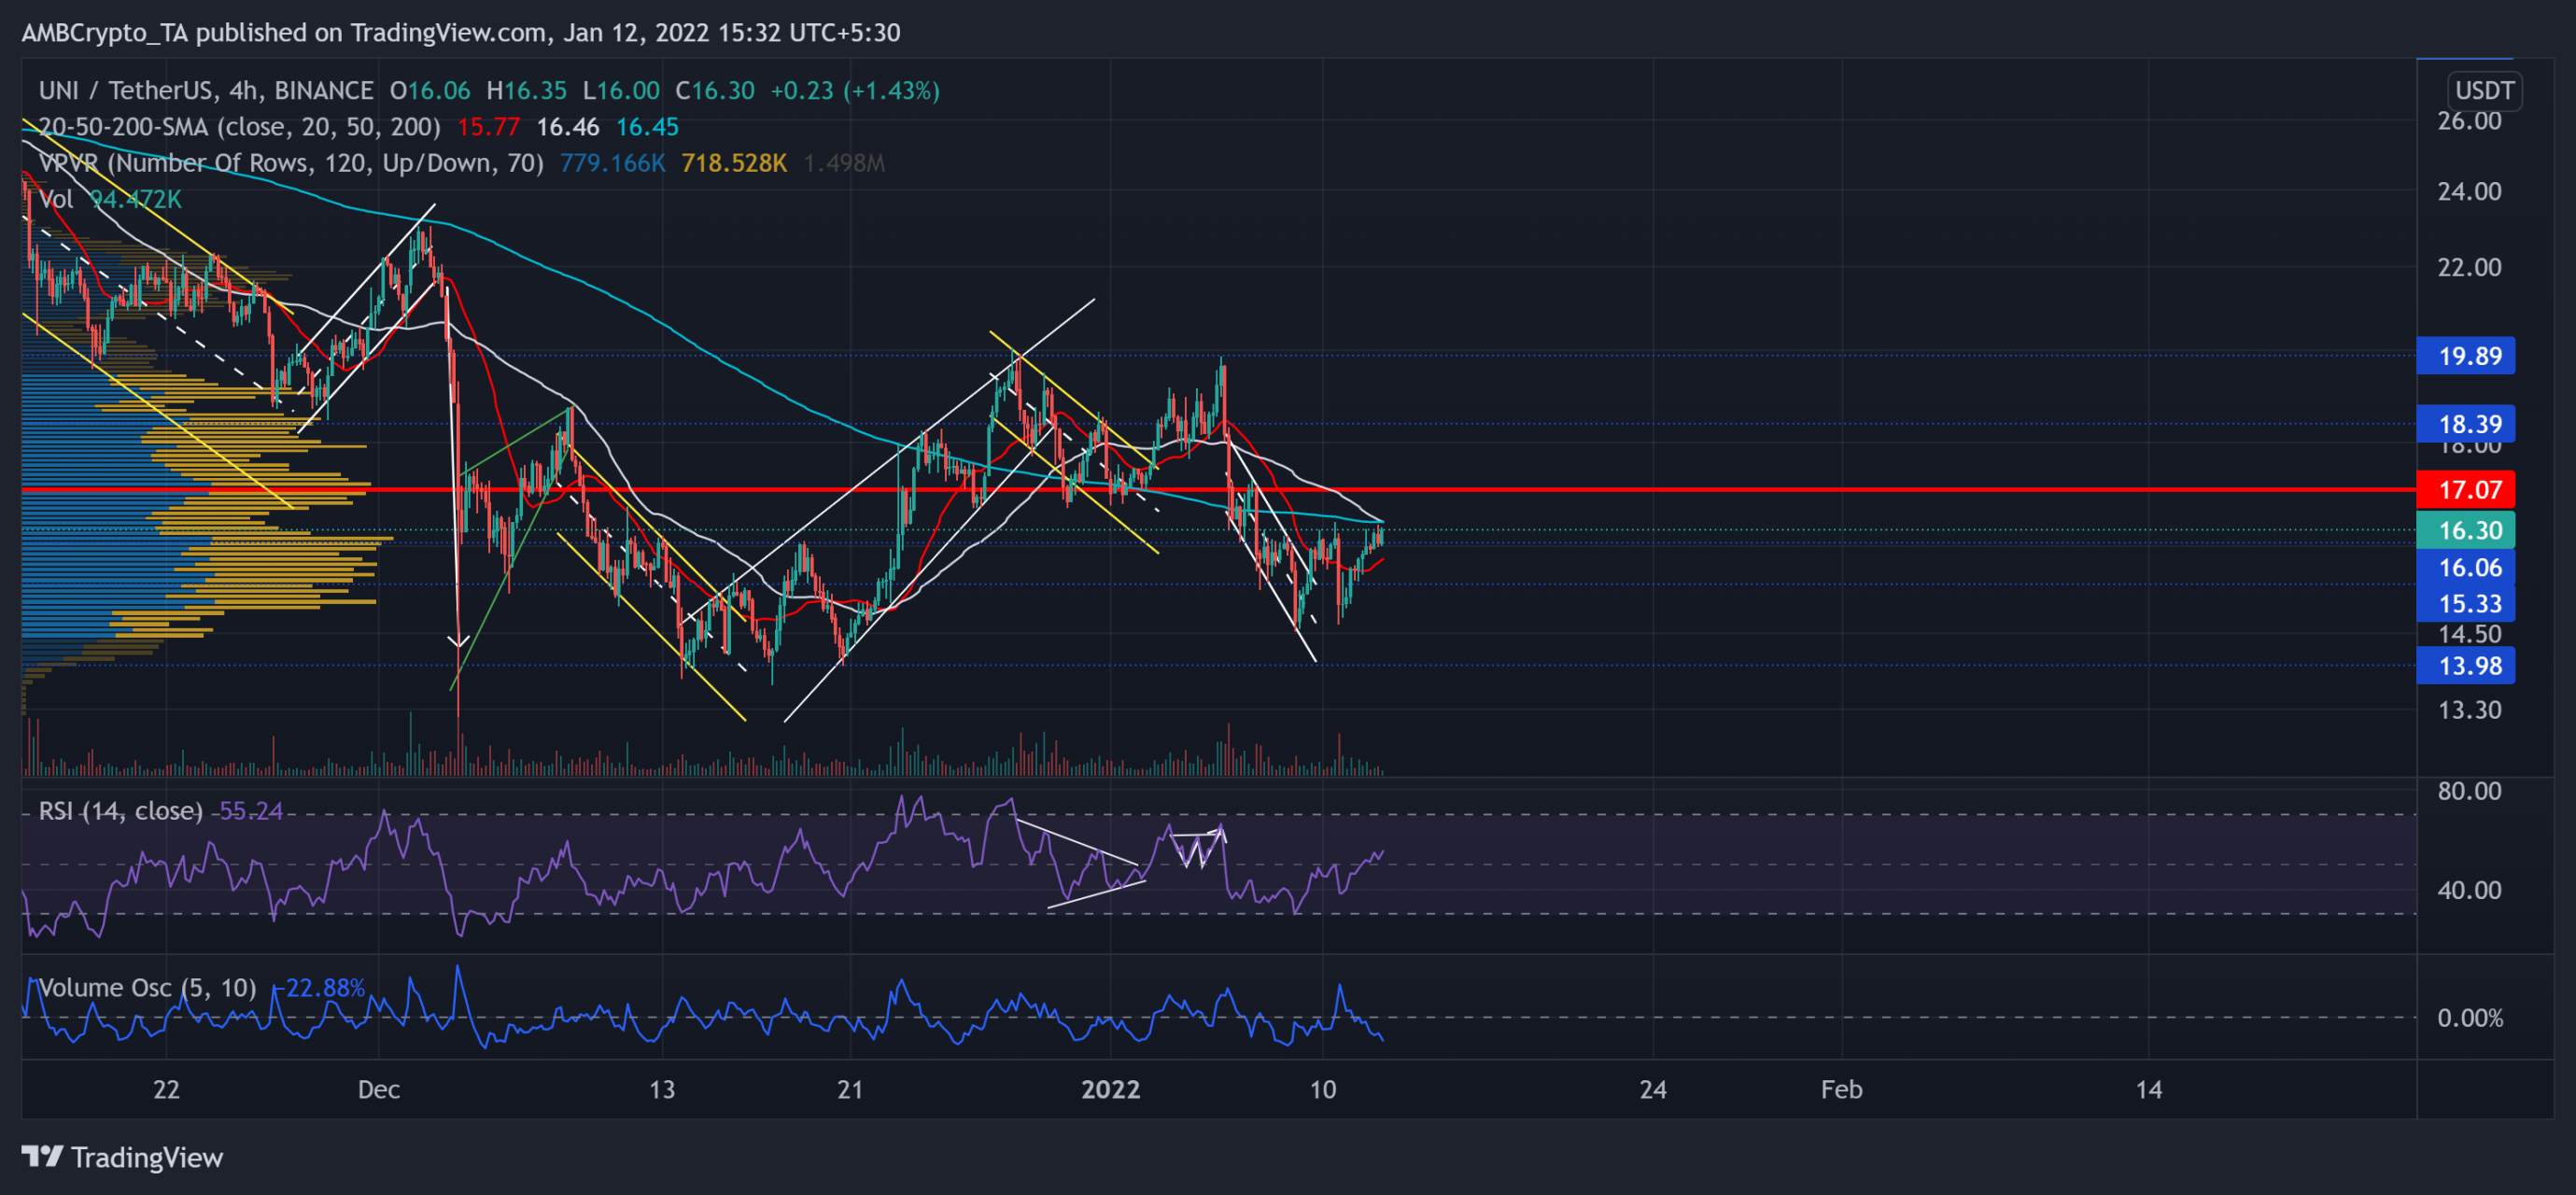
TradingView, UNI/USDT
The rising wedge (white) saw a breakdown from the $19.89-level resistance. Then, the alt saw a 27.3% retracement (from 5 January) until it poked its three-week low on 8 January.
As a result, it fell below its Point of Control (red) and marked a down-channel (white) on its 4-hour chart. The immediate testing point for bulls stood near the 50 SMA (grey) that also coincided with the 200 SMA (cyan) at the $16.4-mark.
At press time, the alt traded at $16.3 after noting an over 10.4% gain in the past two days. The RSI saw a solid recovery above the half-line. It becomes vital to note that the Volume Oscillator steeply plunged during the recent gains, hinting at a weak bullish move.
EOS
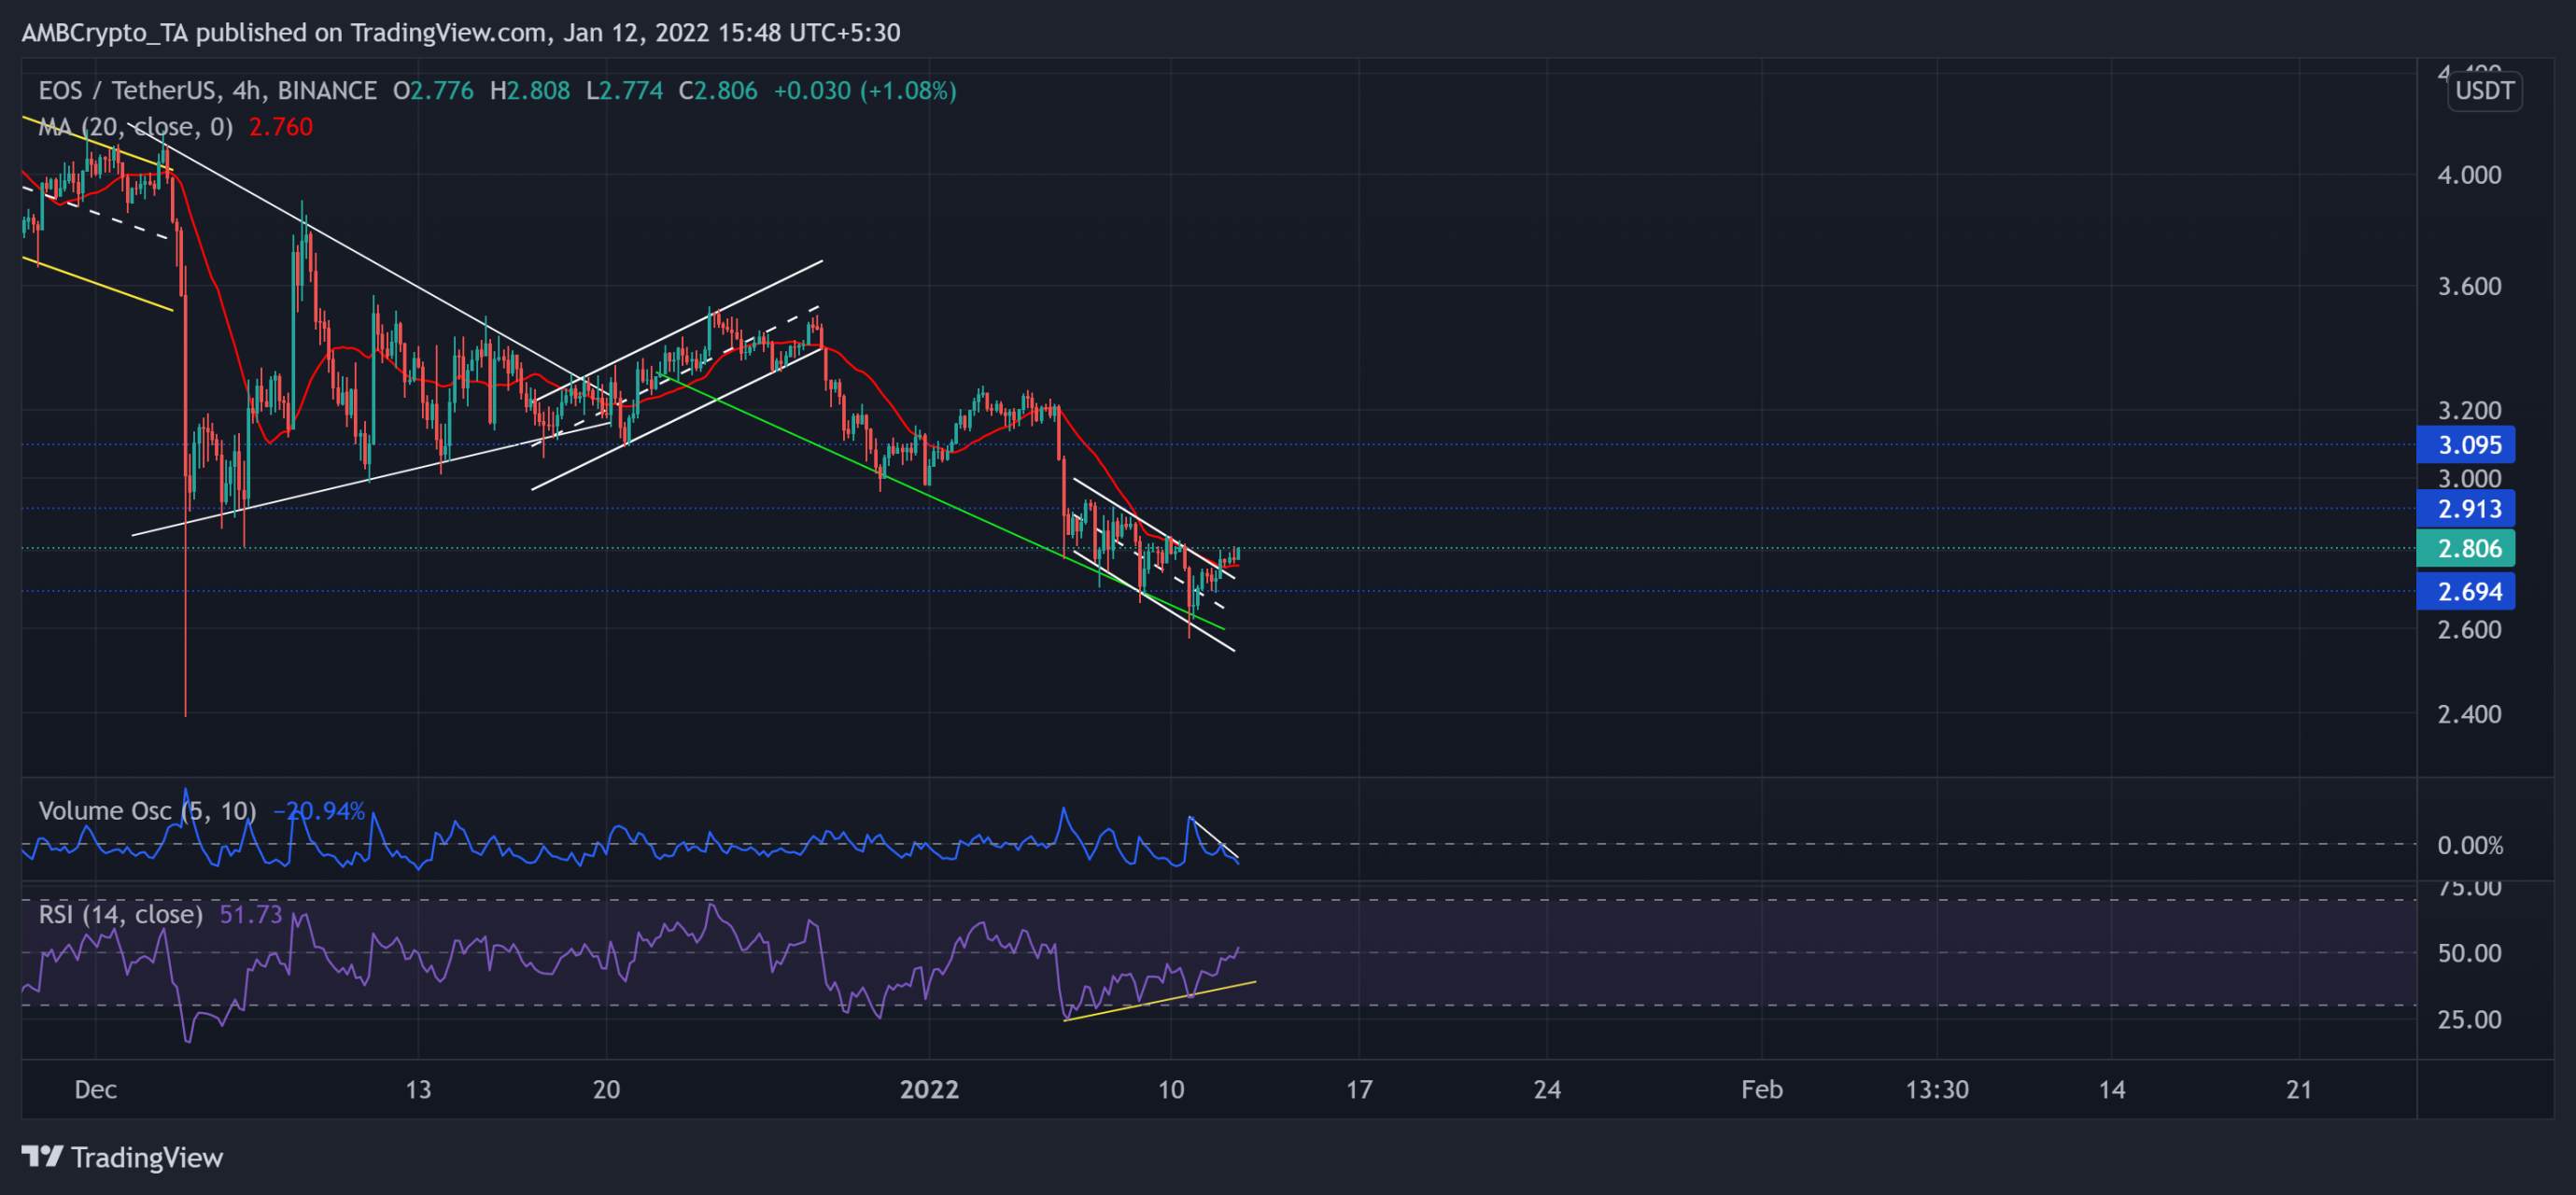
TradingView, EOS/USDT
With a 19.9% retracement (from 5 January), the alt flipped the vital $2.9-mark support to resistance over the past few days. However, After poking its five-week low on 10 January, EOS marked an 8.29% recovery in the past two days.
The digital currency saw a down-channel (white) breakout on its 4-hour chart. Now, as the alt crossed the 20-SMA (red), the $2.9-mark stood as a strong hurdle for the bulls to conquer.
At press time, EOS was trading at $2.806. The RSI poked above half-line after a bullish divergence with the price. However, the Volume Oscillator marked lower peaks, revealing a weak bullish move.
© ambcrypto. Copyright and all rights therein are retained by authors.
风险提示:以上内容仅代表作者或嘉宾的观点,不代表 FOLLOWME 的任何观点及立场,且不代表 FOLLOWME 同意其说法或描述,也不构成任何投资建议。对于访问者根据 FOLLOWME 社区提供的信息所做出的一切行为,除非另有明确的书面承诺文件,否则本社区不承担任何形式的责任。
FOLLOWME 交易社区网址: www.followme.ceo


加载失败()