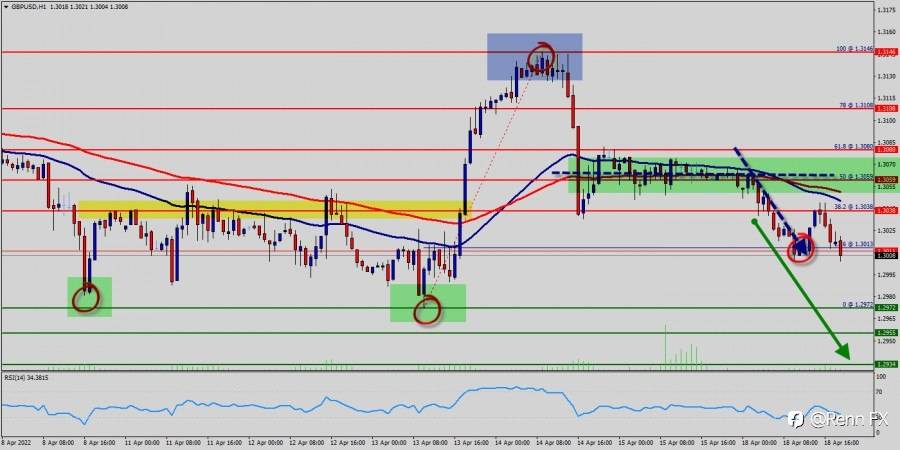
The GBP/USD pair continued to experience negative technical sentiment early in the European session as the pair remains below some important retracement levels (1.3080, 1.3059 and 1.3038) , unable to test and bear breaks above them following a recent resistance level at 1.3038. The GBP/USD pair is positioned at a level that is likely to result in a quick run-down to key levels such as 1.3080, 1.3059 or/and 1.3038. The GBP/USD pair dropped lower since the MA100 rejection and is currently retesting the 50-day and 100-day moving average lines. These MAs have also printed a bearish cross recently, as the 50-day MA has crossed below the 100-day MA. On the hourly chart, the 1.3000 demand zone remains the next significant level of support for the EUR/USD pair. Given the market's bearish momentum and sentiment, another bearish swing towards the 1.2972 support level looks imminent. The trend is still calling for a strong bearish market from the spot of 1.3038. Always, sellers are asking for a high price. The GBP/USD pair settled below the 1.3038 resistance zone, opening the doors for more downsides in the near term. Similarly, The GBP/USD pair could dive if it breaks the 1.2972 support. Today, the first resistance level is seen at 1.3038 followed by 1.3038, while daily support 1 is seen at 1.2955. Furthermore, the moving average (100) starts signaling a downward trend. However, if the pair fails to pass through the level of 1.3038, the market will indicate a bearish opportunity below the strong resistance level of 1.3038 (the level of 1.3038 coincides with the R1). Since there is nothing new in this market, it is not bullish yet. Sell deals are recommended below the level of 1.3038 with the first target at 1.2972. If the trend breaks the support level of 1.2972, the pair is likely to move downwards continuing the development of a bearish trend to the level 1.2955 in order to test the daily support 2 (horizontal green line). If the price breaks below the stated support level, the most probable scenario is a breakdown towards the 1.2955 critical demand area.
风险提示:以上内容仅代表作者或嘉宾的观点,不代表 FOLLOWME 的任何观点及立场,且不代表 FOLLOWME 同意其说法或描述,也不构成任何投资建议。对于访问者根据 FOLLOWME 社区提供的信息所做出的一切行为,除非另有明确的书面承诺文件,否则本社区不承担任何形式的责任。
FOLLOWME 交易社区网址: www.followme.ceo


加载失败()