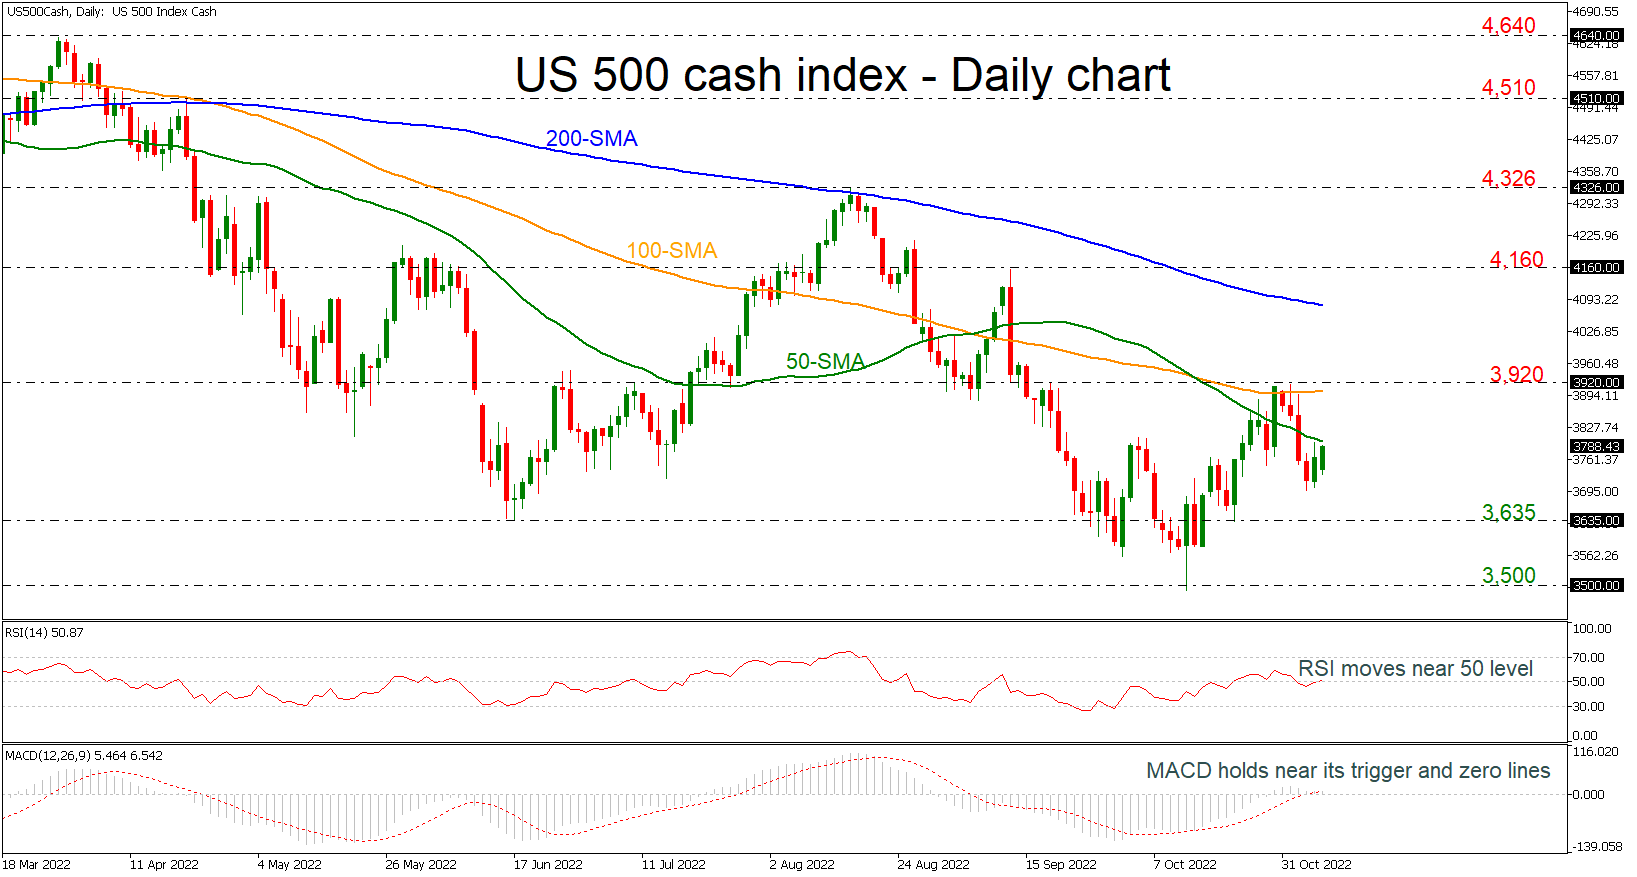
The US 500 stock index is moving slightly higher, approaching the 50-day simple moving average (SMA), holding well above the crucial 200-weekly SMA, which is acting as strong support level near 3,635. The RSI indicator is pointing slightly up near the neutral threshold of 50, while the MACD is moving sideways near its trigger and zero lines.
If price action jumps above the 50-day SMA (immediate resistance), there is scope to test the 100-day SMA around the 3,920 barrier. Clearing this key level would see additional gains towards the 200-day SMA at 4,080.
If the 3,635 support fails, then the focus would shift to the downside towards 3,500, which if breached would increase downside pressure and bring about a reversal of the trend. From here, the index would be on the path towards the 3,233 barrier, registered in October 2020.
Overall, the US 500 index has been negative in the long-term timeframe and only a climb above the 200-day SMA may change the outlook to bullish.
风险提示:以上内容仅代表作者或嘉宾的观点,不代表 FOLLOWME 的任何观点及立场,且不代表 FOLLOWME 同意其说法或描述,也不构成任何投资建议。对于访问者根据 FOLLOWME 社区提供的信息所做出的一切行为,除非另有明确的书面承诺文件,否则本社区不承担任何形式的责任。
FOLLOWME 交易社区网址: www.followme.ceo


加载失败()