| Scenario | |
|---|---|
| Timeframe | Intraday |
| Recommendation | SELL STOP |
| Entry Point | 80.00 |
| Take Profit | 78.00 |
| Stop Loss | 81.00 |
| Key Levels | 77.00, 78.00, 79.14, 80.00, 81.00, 82.00, 83.50, 85.00 |
| Alternative scenario | |
|---|---|
| Recommendation | BUY STOP |
| Entry Point | 81.00 |
| Take Profit | 83.00 |
| Stop Loss | 80.00 |
| Key Levels | 77.00, 78.00, 79.14, 80.00, 81.00, 82.00, 83.50, 85.00 |
Current trend
At the beginning of the trading week, WTI Crude Oil quotes are declining actively, developing a “bearish” signal formed last Thursday, August 10, and approaching the key support level of 80.00.
The instrument is under pressure from statistics from China, confirming the relatively poor pace of recovery of the national economy: in July, the volume of industrial production changed from 3.7% to 4.4%, and the volume of retail sales added only 2.5% instead of the forecasted 4.5%. With a slowdown in activity and growth rates of gross domestic product (GDP), imports of oil and oil products to China are also falling, forcing exporters to reduce production volumes and go for additional optimization of production processes. Meanwhile, the People’s Bank of China cut the interest rate on one-year medium-term loans (MLF) from 2.65% to 2.50% but experts believe that these actions will not act as a serious impetus for economic growth.
Some support for WTI Crude Oil quotes was provided by data from the American Petroleum Institute (API): for the week of August 11, the volume of commercial reserves decreased by a significant 6.195M barrels after an increase of 4.067M barrels over the previous period. Today, investors will focus on a corresponding report from the Energy Information Administration of the US Department of Energy (EIA), where current forecasts suggest a reduction in oil reserves by 2.050M barrels after an increase of 5.851M barrels a week earlier.
Support and resistance
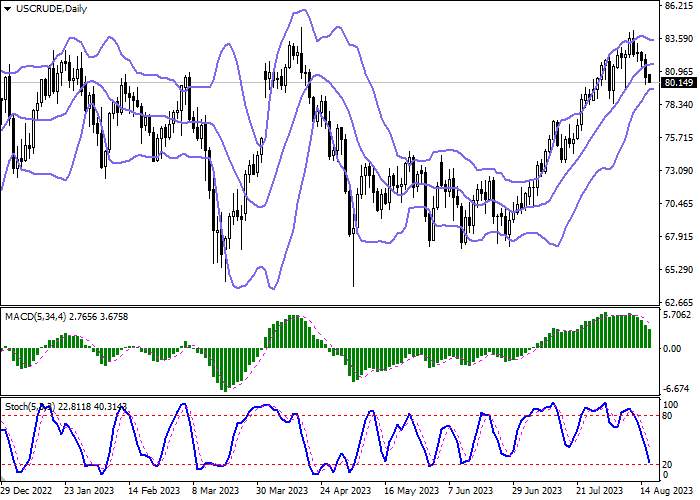
On the daily chart, Bollinger bands reverse into a horizontal plane: the price range has consolidated but remains quite spacious for the current market activity. MACD is declining, keeping a strong sell signal and being below the signal line. Stochastic keeps a confident downward direction but is close to the lows, indicating that the instrument may become oversold soon.
Resistance levels: 81.00, 82.00, 83.50, 85.00.
Support levels: 80.00, 79.14, 78.00, 77.00.


Trading tips
Short positions may be opened after a breakdown of 80.00 with the target at 78.00. Stop loss — 81.00. Implementation period: 1–2 days.
Long positions may be opened after a rebound from 80.00 followed by a breakout of 81.00 with the target at 83.00. Stop loss — 80.00.
风险提示:以上内容仅代表作者或嘉宾的观点,不代表 FOLLOWME 的任何观点及立场,且不代表 FOLLOWME 同意其说法或描述,也不构成任何投资建议。对于访问者根据 FOLLOWME 社区提供的信息所做出的一切行为,除非另有明确的书面承诺文件,否则本社区不承担任何形式的责任。
FOLLOWME 交易社区网址: www.followme.ceo


加载失败()