As gold has strung together weeks of price declines, retail traders have become only more bullish on the precious metal’s prospects, and this could itself constitute a bearish signal, according to DailyFX currency analyst Daniel Dubrovsky.
“Gold prices concluded a fourth consecutive week of losses this past Friday,” Dubrovsky said. “In fact, so far this month, the yellow metal is down about 3.6 percent. That marks the worst performance since February. In response, retail traders have become increasingly bullish gold.”
Dubrovsky said the IG Client Sentiment (IGCS) indicator offers a clear illustration of this. “IGCS tends to function as a contrarian indicator,” he said, and asks “could further pain be in store for XAU/USD?”
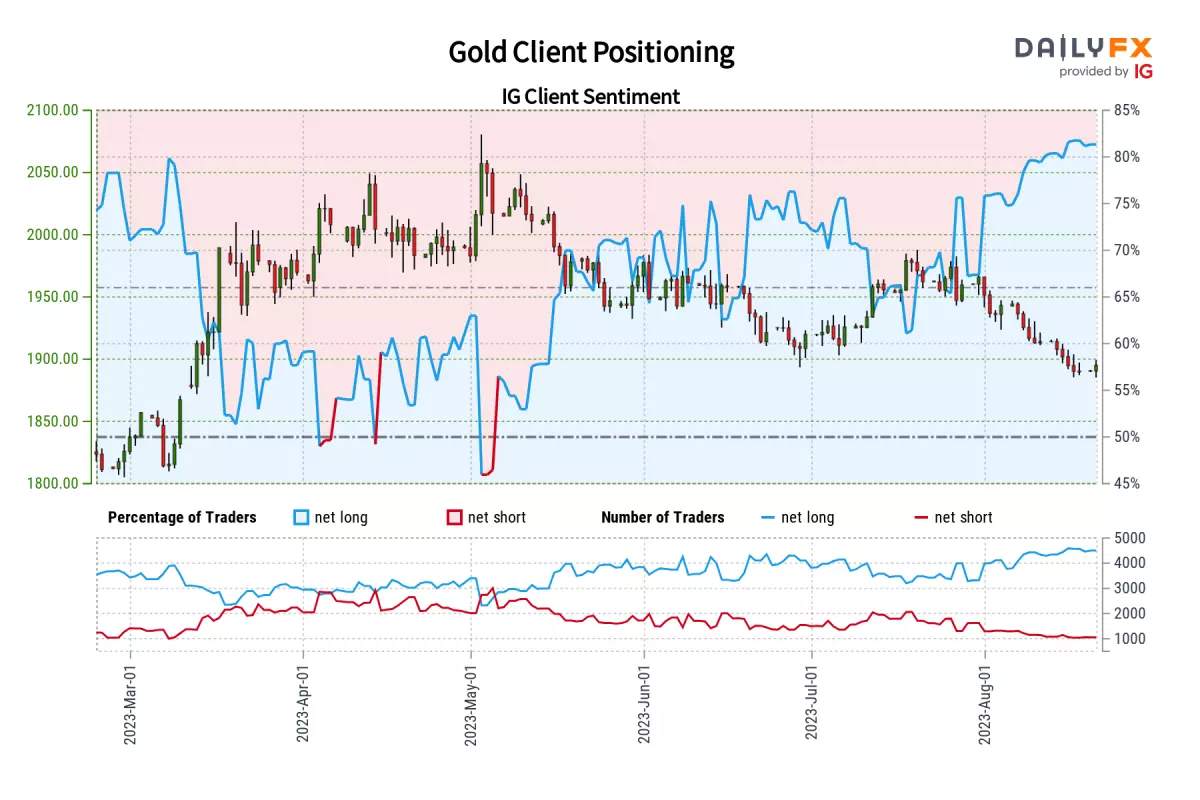
Dubrovsky noted that according to the IGCS, about 81% of retail traders are net-long gold. “Since most of them are biased to the upside, this hints that prices may continue to fall,” he said. “This is as upside exposure increased by 4.02% and 6.91% compared to [Aug. 20] and last week, respectively. With that in mind, this offers a stronger bearish contrarian trading bias for gold.”
Turning to gold’s daily price chart, Dubrovsky said that the precious metal “continues to make further downside progress under the rising trendline from February,” which reinforces an increasingly bearish technical conclusion, even as “a falling trendline from April maintains the broader downside focus.”
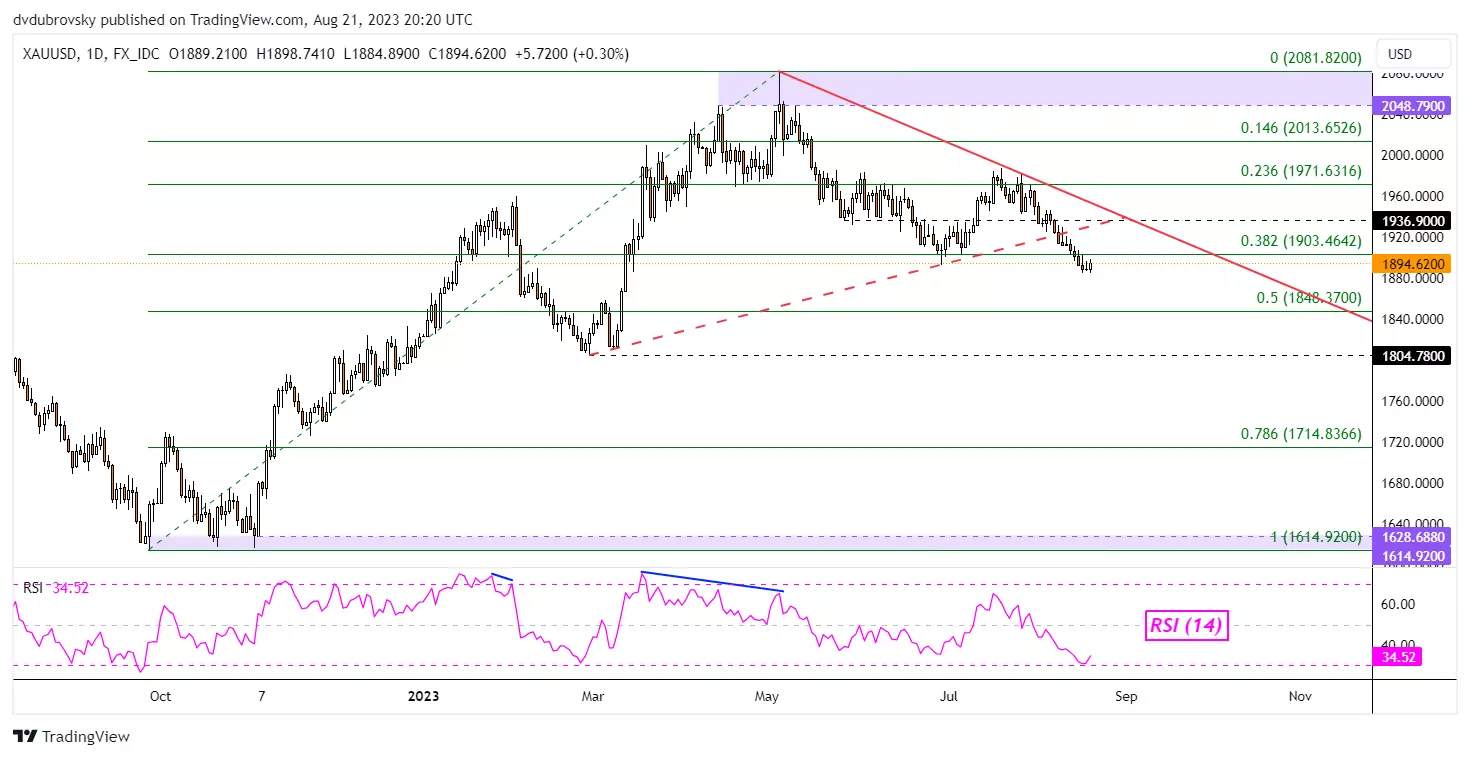
Going forward, Dubrovsky said that immediate resistance is found at the 38.2% Fibonacci retracement level of $1903. “Pushing above this price may open the door to revisiting the falling trendline, which could reinstate a downside focus,” he said. “Otherwise, extending losses places the focus on support which is the midpoint of the Fibonacci retracement at 1848.”
Spot gold last traded at $1897.07, up 0.12% on the session.
风险提示:以上内容仅代表作者或嘉宾的观点,不代表 FOLLOWME 的任何观点及立场,且不代表 FOLLOWME 同意其说法或描述,也不构成任何投资建议。对于访问者根据 FOLLOWME 社区提供的信息所做出的一切行为,除非另有明确的书面承诺文件,否则本社区不承担任何形式的责任。
FOLLOWME 交易社区网址: www.followme.ceo

加载失败()