In the dynamic world of retail, few names stand as tall as Walmart Inc. (NYSE: WMT). With a legacy spanning decades, this retail giant has consistently delivered both value and convenience to millions of consumers around the world. In this article, we delve into the recent bullish performance of Walmart's stock and explore various potential paths using Elliott Wave theory.
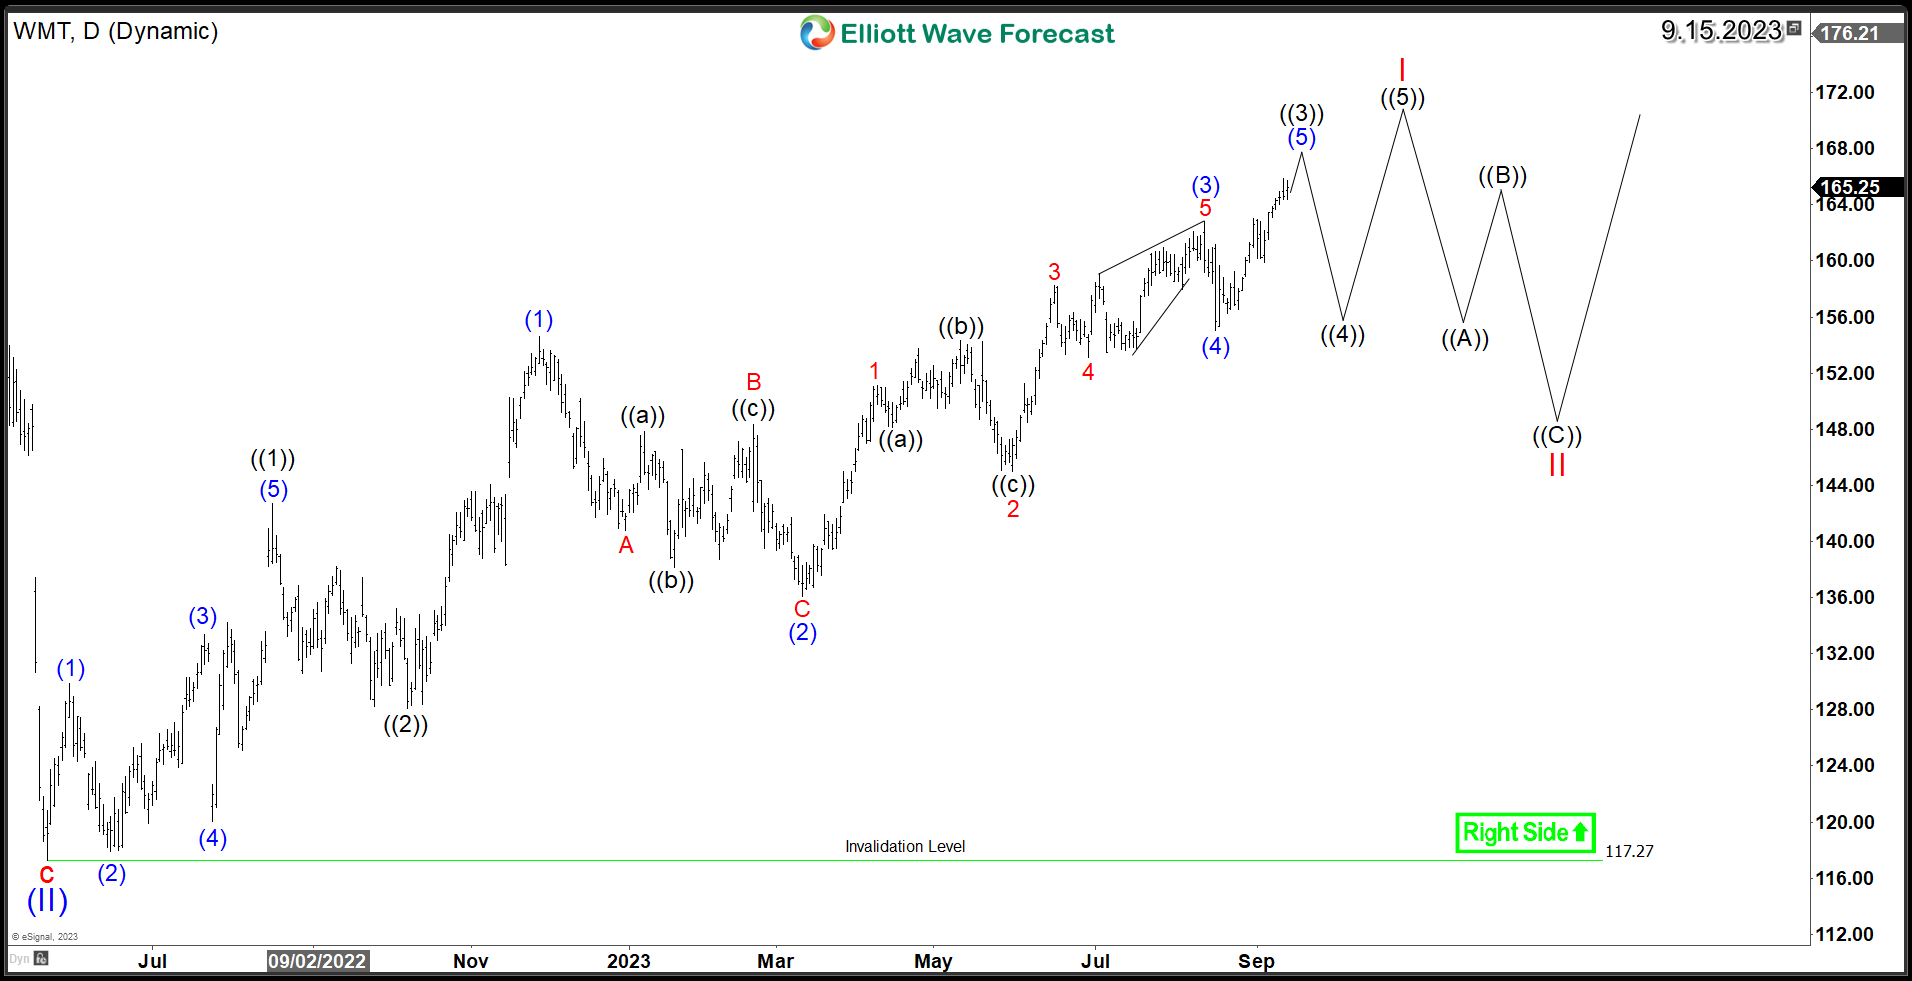
Since May 2022, Walmart (WMT) has experienced a significant surge to the upside, following what appears to be an impulsive structure. The breakthrough above the 2022 peak, resulting in new all-time highs, has confirmed the stock's bullish trajectory on a weekly scale, with expectations for further continuation against the $117.27 low.
If Walmart's stock is following a regular 5-wave advance pattern, we can anticipate one more upward swing before completing wave I. This should be followed by a 3-wave pullback in wave II before the stock resumes its upward trend on the daily chart. The wave II pullback is expected to offer an attractive buying opportunity for investors, potentially occurring in 3, 7, or 11 swings, while maintaining support above the $117.27 level.
WMT Daily Elliott Wave Chart 9.15.2023
风险提示:以上内容仅代表作者或嘉宾的观点,不代表 FOLLOWME 的任何观点及立场,且不代表 FOLLOWME 同意其说法或描述,也不构成任何投资建议。对于访问者根据 FOLLOWME 社区提供的信息所做出的一切行为,除非另有明确的书面承诺文件,否则本社区不承担任何形式的责任。
FOLLOWME 交易社区网址: www.followme.ceo


加载失败()