| Scenario | |
|---|---|
| Timeframe | Weekly |
| Recommendation | BUY STOP |
| Entry Point | 1.0980 |
| Take Profit | 1.1100 |
| Stop Loss | 1.0900 |
| Key Levels | 1.0790, 1.0920, 1.0980, 1.1100 |
| Alternative scenario | |
|---|---|
| Recommendation | SELL STOP |
| Entry Point | 1.0920 |
| Take Profit | 1.0790 |
| Stop Loss | 1.1000 |
| Key Levels | 1.0790, 1.0920, 1.0980, 1.1100 |
Current trend
The EUR/USD pair is moving in a correction trend, renewed the high of January 2 at 1.1000 yesterday. The euro is strengthening against its competitors despite ambiguous macroeconomic statistics from the EU.
Thus, the service PMI in Spain adjusted from 56.8 points to 53.9 points, in Italy – from 53.7 points to 51.7 points, in France – from 49.6 points to 50.1 points, and in Germany – from 53.1 points to 52.5 points. Thus, the consolidated indicator fell from 52.8 points to 51.9 points, which became the fifth month of negative dynamics, reflecting the ongoing problems in the sector, which are largely associated with the low level of consumer spending. The S&P Global index fell from 50.9 to 50.2, confirming that the situation remains challenging in other areas of the economy.
The American dollar is correcting at 102.60 in USDX as investors looked to the Institute for Supply Management (ISM) non-manufacturing PMI growth from 48.8 to 51.4, which could provide a basis for further recovery in the sector. On the other hand, poor labor market data has increased the probability of the US Fed easing monetary policy at its September meeting to 80.0%, with many analysts now considering a 50 basis point adjustment. Sharp changes in the currency markets led to a decline in stock exchanges, which opened in the red zone around the world on Monday, which only increased concerns about a global slowdown in the world economy.
Support and resistance
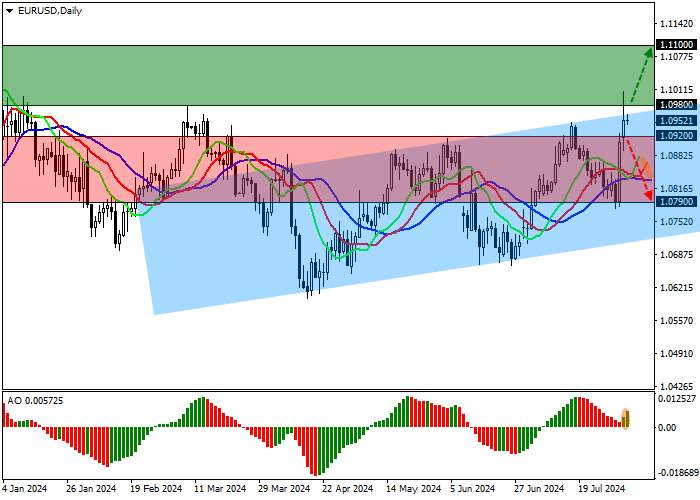
On the daily chart, the trading instrument is correcting, approaching the resistance line of the ascending channel with dynamic boundaries of 1.0990–1.0720.
Technical indicators are strengthening the buy signal: fast EMA on the Alligator indicator are moving away from the signal line, expanding the range of fluctuations, and the AO histogram is forming ascending bars, rising in the buy zone.
Resistance levels: 1.0980, 1.1100.
Support levels: 1.0920, 1.0790.

Trading tips
Long positions may be opened after the price rises and consolidates above 1.0980, with the target at 1.1100. Stop loss – 1.0900. Implementation period: 7 days or more.
Short positions may be opened after the price declines and consolidates below 1.0920, with the target at 1.0790. Stop loss is around 1.1000.
风险提示:以上内容仅代表作者或嘉宾的观点,不代表 FOLLOWME 的任何观点及立场,且不代表 FOLLOWME 同意其说法或描述,也不构成任何投资建议。对于访问者根据 FOLLOWME 社区提供的信息所做出的一切行为,除非另有明确的书面承诺文件,否则本社区不承担任何形式的责任。
FOLLOWME 交易社区网址: www.followme.ceo


加载失败()