| Scenario | |
|---|---|
| Timeframe | Weekly |
| Recommendation | SELL STOP |
| Entry Point | 77.20 |
| Take Profit | 73.30 |
| Stop Loss | 79.00 |
| Key Levels | 73.30, 77.20, 80.00, 83.60 |
| Alternative scenario | |
|---|---|
| Recommendation | BUY STOP |
| Entry Point | 80.00 |
| Take Profit | 83.60 |
| Stop Loss | 78.00 |
| Key Levels | 73.30, 77.20, 80.00, 83.60 |
Current trend
Brent Crude Oil prices are correcting in a weak downward trend, holding below 79.00. The hydrocarbon market is not stable, and asset prices have changed direction multiple times during the week, which is largely due to the fundamental background, which remains mixed.
The day before, it became known that following the visit of OPEC Secretary General Haitham al-Ghais to Iraq and Kazakhstan, these countries developed plans to gradually compensate for the under-reduced volumes of "black gold" production, which will take into account the excess of the plan under the OPEC deal from January to July 2024. The Iraqi authorities will compensate for the missing 1.44 million barrels per day until September 2025, and Kazakhstan will compensate for 0.699 million barrels per day, which should ultimately contribute to more flexible regulation of energy prices.
Also, this week, US oil inventory data was released. The American Petroleum Institute (API) figure fell by 3.400 million barrels after a slight increase of 0.347 million barrels the week before, while the Energy Information Administration (EIA) report showed a decline of 0.846 million barrels, in line with expectations. Thus, the overall decline in the volume of "black gold" since mid-summer has already exceeded 31.0 million barrels, continuing for more than nine weeks in a row, and it will be quite difficult to compensate for it.
Meanwhile, according to the US Commodity Futures Trading Commission (CFTC) report, the number of net speculative positions in crude oil fell to 222.3 thousand from 231.5 thousand last week, leaving the balance virtually unchanged and only slightly offsetting the growth of the previous week. Such dynamics fully reflect the movement of quotes on the market.
Support and resistance
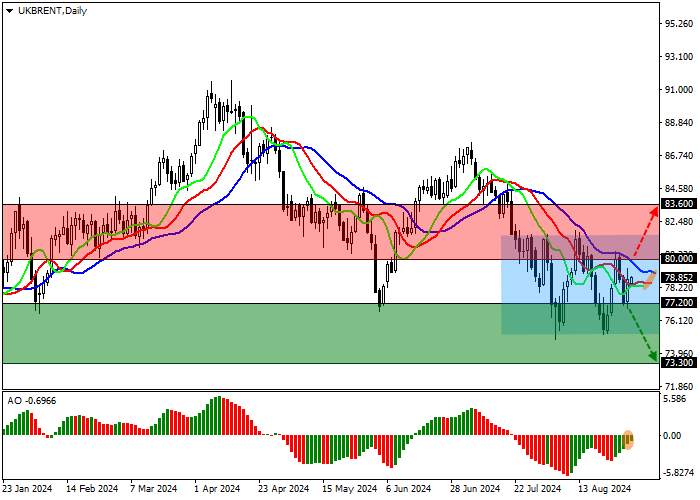
On the daily chart of the asset, the price is trading in a corrective trend, forming a local sideways channel with boundaries of 82.00–75.50.
Technical indicators continue holding an unsteady sell signal: fast EMAs on the Alligator indicator are approaching the signal line, and the AO histogram is forming corrective bars being in the sale zone.
Support levels: 77.20, 73.30.
Resistance levels: 80.00, 83.60.

Trading tips
Short positions can be opened after the price consolidates below the support level of 77.20 with the target of 73.30. Stop-loss — 79.00. Implementation time: 7 days and more.
Long positions should be opened after the price consolidates above the resistance level of 80.00 with the target of 83.60. Stop-loss — 78.00.
风险提示:以上内容仅代表作者或嘉宾的观点,不代表 FOLLOWME 的任何观点及立场,且不代表 FOLLOWME 同意其说法或描述,也不构成任何投资建议。对于访问者根据 FOLLOWME 社区提供的信息所做出的一切行为,除非另有明确的书面承诺文件,否则本社区不承担任何形式的责任。
FOLLOWME 交易社区网址: www.followme.ceo


加载失败()