| Scenario | |
|---|---|
| Timeframe | Weekly |
| Recommendation | BUY LIMIT |
| Entry Point | 1.3438 |
| Take Profit | 1.3530 |
| Stop Loss | 1.3409 |
| Key Levels | 1.3316, 1.3378, 1.3438, 1.3616, 1.3780 |
| Alternative scenario | |
|---|---|
| Recommendation | SELL STOP |
| Entry Point | 1.3405 |
| Take Profit | 1.3316 |
| Stop Loss | 1.3450 |
| Key Levels | 1.3316, 1.3378, 1.3438, 1.3616, 1.3780 |
Current trend
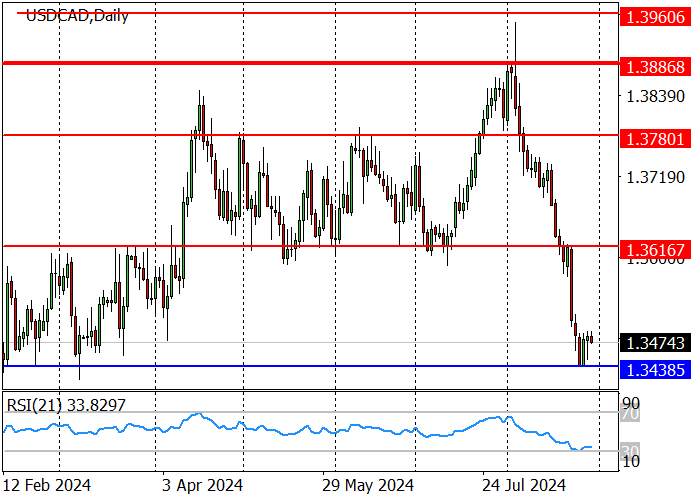
The USD/CAD pair’s long-term trend reversed downwards last week and reached 1.3438 but is currently trying to correct upwards.
The negative dynamics are associated with the strengthening of the Canadian dollar amid a likely change in the US Fed’s monetary policy at the September meeting and the recovery of oil prices. Thus, WTI Crude Oil, after reaching a low of 72.48 last week, tested 77.00, adding 6.2% in value. Since Canada is a leading oil exporter, it supports the national currency.
Another factor negatively affecting the dynamics of the American dollar is investor expectations regarding the US Fed’s interest rate cut at the meeting on September 18. According to the Chicago Mercantile Exchange (CME) FedWatch Instrument, markets are pricing in a 67.0% probability of a change in the indicator by –25 basis points and 33.0% by –50 basis points. Thursday’s data reflected a revision of the US Q2 economic growth rate from 2.8% to 3.0%, reducing the likelihood of faster monetary easing. Initial jobless claims for the week ending August 23 changed from 233.0K to 231.0K, which was close to the forecast of 232.0K. The personal consumption expenditure report may also act as a driver for a change in the “hawkish” rhetoric of monetary authorities. Analysts expect the core index to accelerate from 2.6% to 2.7% in July, and the broader one – from 2.5% to 2.6%. Against this background, the trading instrument changed its long-term trend to a downward one last week, breaking through the key support level of 1.3616 and reaching the support line of 1.3438. If other major market participants join the purchases, the price may go into an upward correction, with the target at 1.3616. A breakout of 1.3438 will allow the quotes to fall to 1.3378 and 1.3316. The RSI (21) indicator entered the oversold zone.
The medium-term trend remains downward: last week the asset overcame zone 2 (1.3568–1.3550) and headed towards zone 3 (1.3387–1.3369). The key resistance is shifting to 1.3641–1.3623, after reaching which short positions, with the target at the low of the current week of 1.3438 are relevant. To change the trend upward, the asset needs to consolidate above 1.3641.
Support and resistance
Resistance levels: 1.3616, 1.3780.
Support levels: 1.3438, 1.3378, 1.3316.


Trading tips
Long positions may be opened from 1.3438, with the target at 1.3530 and stop loss 1.3409. Implementation period: 9–12 days.
Short positions may be opened below 1.3409, with the target at 1.3316 and stop loss 1.3450.
风险提示:以上内容仅代表作者或嘉宾的观点,不代表 FOLLOWME 的任何观点及立场,且不代表 FOLLOWME 同意其说法或描述,也不构成任何投资建议。对于访问者根据 FOLLOWME 社区提供的信息所做出的一切行为,除非另有明确的书面承诺文件,否则本社区不承担任何形式的责任。
FOLLOWME 交易社区网址: www.followme.ceo


加载失败()