We present a medium-term investment review of the XAG/USD pair.
The assets of the metal group are preparing to interrupt the confident upward trend ahead of the September meeting of the US Fed, following which the vector of monetary policy may be changed. Thus, the cost of silver is approaching the intermediate low of 26.00. Its dynamics are influenced by opposite factors, which together provide a neutral position.
Since the production of electric vehicles, solar panels, and electronics generates up to 80.0% of industrial demand for the metal, the relatively low cost compared to analogs such as platinum and palladium will ensure a high indicator for a long time. On the other hand, the quotes are affected by the growth of consumer prices negatively. Previously, silver served as a protective asset but the world’s leading regulators have already almost returned inflation to stable levels of about 2.0%, which is forcing investors to reconsider their strategies. Silver is also often in demand as a cheaper alternative to gold but the latter’s quotes are actively growing and may update annual highs, remaining more preferable for traders.
As for investment demand for silver contracts, according to the report of the Chicago Mercantile Exchange (CME Group) since mid-August, the trading volume began to decline, reaching a June low of 63.5K on August 30. The quotes are under pressure from a small option position, which on September 2 and 3 amounted to 17.3K and 27.2K, compared to an average of 50.0K contracts during the previous increase in May.
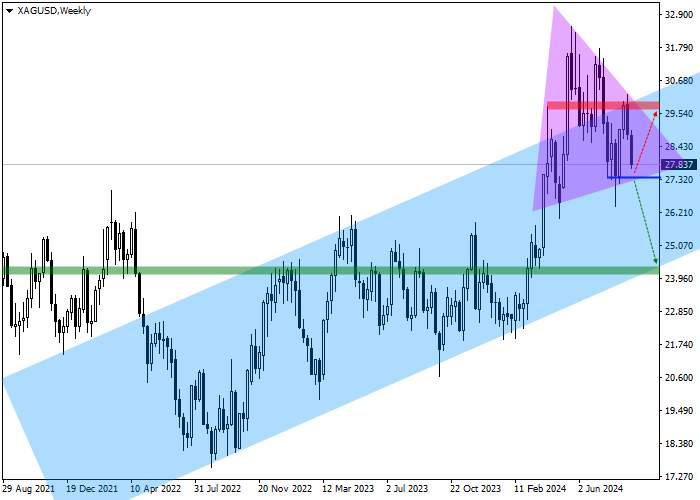
As a result, the potential for strengthening the correction dynamics is still high. The long-term trend points to the XAG/USD pair moving towards the average levels of 2022–2023 around 24.00, confirmed by the readings of technical indicators. On the weekly chart, the price is held within the ascending channel with dynamic boundaries of 30.70–24.00, returning to the range after an unsuccessful attempt to overcome the resistance line of 30.00.

The channel has been forming for more than two years, and up to now, the resistance line has been tested twice, so its strength is beyond doubt. Moreover, the proximity of the price to the local low of 27.00 increases the likelihood of negative dynamics developing.
Let’s consider the key levels on the daily chart.

On the daily chart, the quotes have almost completed the formation of the Second shoulder of the reversal pattern Head and shoulders with the Neckline around 27.30, consolidation below which will become a driver for the implementation of the formation, strengthening the downward signal. If the high of the second shoulder is reached at 30.00, the downward scenario will either be canceled or significantly delayed in time, and it is better to liquidate open sell positions. If the price drops to the support level of the ascending channel at 24.00, it is better to take profit on open sell positions.
Let’s assess the entry levels in more detail on the four-hour chart.

The entry-level for sell transactions is at 27.20, coinciding with the low level of August 14, after which the current trend will begin its implementation.
Given the average daily volatility of the trading instrument over the last month, which is 59.0 points, the movement to the target of 24.00 may take approximately 34 trading sessions but with an increase in volatility, this time may be reduced to 29 trading days.
风险提示:以上内容仅代表作者或嘉宾的观点,不代表 FOLLOWME 的任何观点及立场,且不代表 FOLLOWME 同意其说法或描述,也不构成任何投资建议。对于访问者根据 FOLLOWME 社区提供的信息所做出的一切行为,除非另有明确的书面承诺文件,否则本社区不承担任何形式的责任。
FOLLOWME 交易社区网址: www.followme.ceo


加载失败()