| Scenario | |
|---|---|
| Timeframe | Weekly |
| Recommendation | SELL STOP |
| Entry Point | 68.00 |
| Take Profit | 64.23, 60.89, 57.03 |
| Stop Loss | 69.70 |
| Key Levels | 57.03, 60.89, 64.23, 68.03, 71.37, 74.15, 77.86, 80.88 |
| Alternative scenario | |
|---|---|
| Recommendation | BUY STOP |
| Entry Point | 71.40 |
| Take Profit | 74.15, 77.86, 80.88 |
| Stop Loss | 69.70 |
| Key Levels | 57.03, 60.89, 64.23, 68.03, 71.37, 74.15, 77.86, 80.88 |
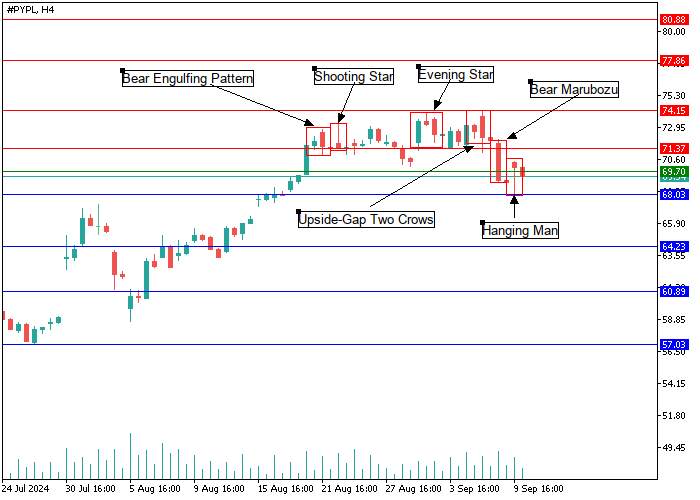
PayPal Holdings Inc., H4
On the H4 chart of shares of PayPal Holdings Inc., an American debit payment system, there is a formation of a series of reversal patterns of candle analysis "Bear Engulfing Pattern", "Shooting Star", "Evening Star", "Bear Marubozu", "Upside-Gap Two Crows" and "Hanging Man" in the price range 74.15-69.70, which signal about the strong pressure on the price from sellers. Overcoming the key resistance level of 68.03 may provoke a further decline in the quotes of the trading instrument to the area of 64.23–57.03. If "bullish" patterns form on the chart, and the price can overcome the resistance level of 71.37 on increased trading volumes, one should expect a continuation of positive dynamics to the area of 74.15–80.88.

PayPal Holdings Inc., D1
On the D1 chart, asset quotes move within the short–term uptrend, forming in the area of 74.15-68.03 the candle patterns "Dark-Cloud Cover", "Bear Marubozu", "Shooting Star" and "Hanging Man", which signal a "bearish" reversal and warn market participants about reaching the high price area. In the current situation, a more likely scenario is a decrease in the value of the asset to the key support level of 68.03, overcoming which will become a catalyst for opening short positions with targets in the area of 64.23–57.03.

Support and resistance
Support levels: 68.03, 64.23, 60.89, 57.03.
Resistance levels: 71.37, 74.15, 77.86, 80.88.
Trading tips
Short positions can be opened below the 68.03 mark with targets 64.23, 60.89, 57.03. Stop-loss – 69.70. Implementation time: 9–12 days.
Long positions can be opened above 71.37 with targets of 74.15, 77.86, 80.88. Stop-loss – 69.70.
风险提示:以上内容仅代表作者或嘉宾的观点,不代表 FOLLOWME 的任何观点及立场,且不代表 FOLLOWME 同意其说法或描述,也不构成任何投资建议。对于访问者根据 FOLLOWME 社区提供的信息所做出的一切行为,除非另有明确的书面承诺文件,否则本社区不承担任何形式的责任。
FOLLOWME 交易社区网址: www.followme.ceo


加载失败()