| Scenario | |
|---|---|
| Timeframe | Intraday |
| Recommendation | SELL |
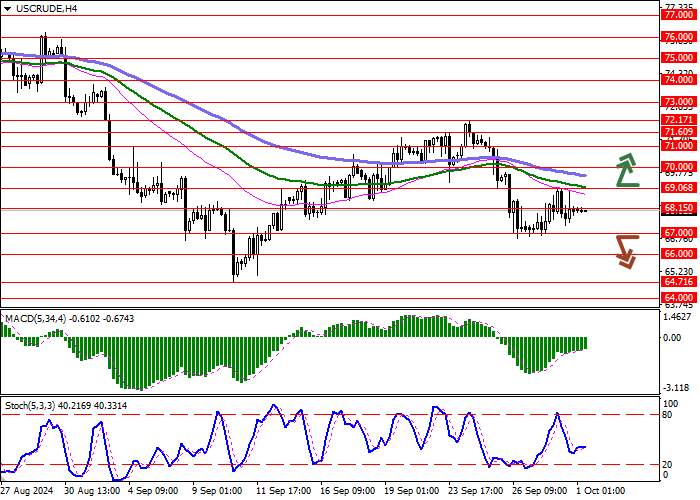
| Entry Point | 66.99 |
| Take Profit | 64.71 |
| Stop Loss | 68.15 |
| Key Levels | 64.00, 64.71, 66.00, 67.00, 68.15, 69.06, 70.00, 71.00 |
| Alternative scenario | |
|---|---|
| Recommendation | BUY STOP |
| Entry Point | 69.10 |
| Take Profit | 71.00 |
| Stop Loss | 68.15 |
| Key Levels | 64.00, 64.71, 66.00, 67.00, 68.15, 69.06, 70.00, 71.00 |
Current trend
During the Asian session, WTI Crude Oil prices show ambiguous dynamics, holding near 68.00.
Yesterday, the American dollar strengthened slightly, supported by statements by the head of the US Fed, Jerome Powell, who signaled for a more restrained reduction in interest rates until the end of 2024. Thus, in September, the indicator changed by –50 basis points, and analysts assumed that the volume of the subsequent adjustment would be the same but now, a reduction of 25 basis points is again considered the current scenario. However, variations in the expected vector of monetary policy are still possible, given the instability of the national economy and the approaching presidential elections.
At the end of this week, September labor market statistics are due. According to forecasts, nonfarm payrolls will decrease from 142.0K to 140.0K, and the average hourly wage from 0.4% to 0.3% MoM, remaining at 3.8% YoY. The unemployment rate may be the same 4.2%. Today, investors will pay attention to data from the American Petroleum Institute (API) on the dynamics of commercial oil stocks for the week of September 27. Previously, it fell by 4.339M barrels. The price is under pressure from a possible sharp increase in oil production by Saudi Arabia. Under the OPEC agreement, countries will begin to lift restrictions from December 1 but experts fear that the supply increase will be too sharp.
The market is still in a correction. According to the latest report from the US Commodity Futures Trading Commission (CFTC), last week, net speculative positions in WTI Crude Oil increased from 145.3K to 158.6K. As for the dynamics, the “bears” prevail, and their balance among producers was 322.704K against 358.051K among the “bulls.” Last week, buyers increased the number of contracts by 0.358K and sellers — by 13.133K.
Support and resistance
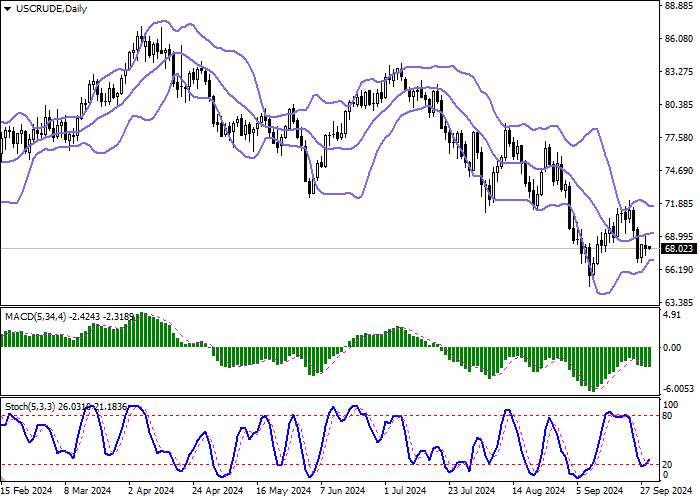
On the daily chart, Bollinger bands are moving flat: the price range remains practically unchanged, remaining quite spacious for the market activity. The MACD indicator is declining, maintaining a sell signal (the histogram is below the signal line). Stochastic rebounded from “20” and is reversing into an ascending plane, signaling a full-fledged “bullish” correction in the ultra-short term.
Resistance levels: 68.15, 69.06, 70.00, 71.00.
Support levels: 67.00, 66.00, 64.71, 64.00.

Trading tips
Short positions may be opened after a breakdown of 67.00, with the target at 64.71. Stop loss — 68.15. Implementation period: 2–3 days.
Long positions may be opened after a breakout of 69.06, with the target at 71.00. Stop loss — 68.15.
风险提示:以上内容仅代表作者或嘉宾的观点,不代表 FOLLOWME 的任何观点及立场,且不代表 FOLLOWME 同意其说法或描述,也不构成任何投资建议。对于访问者根据 FOLLOWME 社区提供的信息所做出的一切行为,除非另有明确的书面承诺文件,否则本社区不承担任何形式的责任。
FOLLOWME 交易社区网址: www.followme.ceo


加载失败()