| Scenario | |
|---|---|
| Timeframe | Intraday |
| Recommendation | SELL STOP |
| Entry Point | 0.8640 |
| Take Profit | 0.8600 |
| Stop Loss | 0.8669 |
| Key Levels | 0.8541, 0.8570, 0.8600, 0.8641, 0.8669, 0.8700, 0.8730, 0.8776 |
| Alternative scenario | |
|---|---|
| Recommendation | BUY STOP |
| Entry Point | 0.8670 |
| Take Profit | 0.8730 |
| Stop Loss | 0.8641 |
| Key Levels | 0.8541, 0.8570, 0.8600, 0.8641, 0.8669, 0.8700, 0.8730, 0.8776 |
Current trend
During the morning session, the USD/CHF pair is consolidating near the highs of August 16 at 0.8660 as traders await the publication of US business activity statistics for October from S&P Global at 15:45 (GMT 2).
Thus, the manufacturing PMI may increase from 47.3 points to 47.5 points, while the service PMI may decrease from 55.2 points to 55.0 points. Meanwhile, investors are assessing the dynamics of existing home sales, which changed from –2.0% to –1.0%, and the monthly economic review from the US Fed Beige Book, which reflected either the preservation or a moderate decline in economic activity in the regions. Most counties reported a slowdown in manufacturing, while the banking sector remained stable or strengthened. The real estate sector is unchanged, although the shortage of affordable housing in many cities remains a serious problem.
There were no important statistics for investors in Switzerland this week, and traders are awaiting the October EU business activity data at 10:00 (GMT 2) today. According to preliminary estimates, the manufacturing PMI will be adjusted from 45.0 points to 45.1 points, the service PMI from 51.4 points to 51.6 points, and the composite PMI from 49.6 points to 49.7 points.
Support and resistance
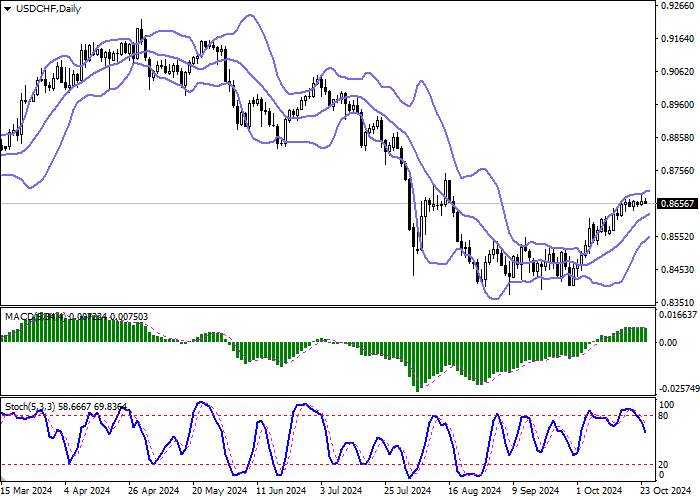
On the daily chart, Bollinger bands are growing moderately: the price range is narrowing, reflecting the emergence of ambiguous trading dynamics in the ultra-short term. The MACD indicator is slightly decreasing, trying to form a new sell signal (the histogram is attempting to settle below the signal line). Stochastic is retreating from the highs, signaling the development of a full-fledged downtrend in the ultra-short term.
Resistance levels: 0.8669, 0.8700, 0.8730, 0.8776.
Support levels: 0.8641, 0.8600, 0.8570, 0.8541.


Trading tips
Short positions may be opened after a breakdown of the 0.8641 level, with the target at 0.8600. Stop loss — 0.8669. Implementation period: 1–2 days.
Long positions may be opened after a rebound from the 0.8641 level and a breakout of the 0.8669 level, with the target at 0.8730. Stop loss — 0.8641.
风险提示:以上内容仅代表作者或嘉宾的观点,不代表 FOLLOWME 的任何观点及立场,且不代表 FOLLOWME 同意其说法或描述,也不构成任何投资建议。对于访问者根据 FOLLOWME 社区提供的信息所做出的一切行为,除非另有明确的书面承诺文件,否则本社区不承担任何形式的责任。
FOLLOWME 交易社区网址: www.followme.ceo


加载失败()