| Scenario | |
|---|---|
| Timeframe | Weekly |
| Recommendation | BUY STOP |
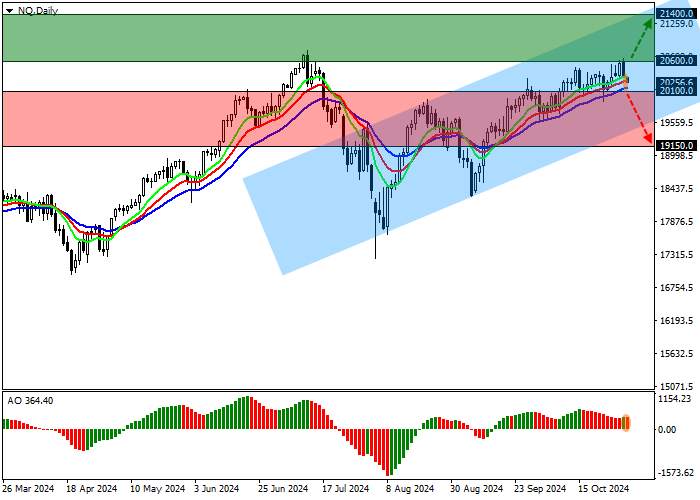
| Entry Point | 20600.5 |
| Take Profit | 21400.0 |
| Stop Loss | 20300.0 |
| Key Levels | 19150.0, 20100.0, 20600.0, 21400.0 |
| Alternative scenario | |
|---|---|
| Recommendation | SELL STOP |
| Entry Point | 20099.5 |
| Take Profit | 19150.0 |
| Stop Loss | 20400.0 |
| Key Levels | 19150.0, 20100.0, 20600.0, 21400.0 |
Current trend
The NQ 100 index is holding at around 20254.0 amid the publication of corporate reports.
Among the companies that presented financial results yesterday, one can highlight the technology corporation Microsoft Corp., which showed revenue of 65.6 billion dollars, which exceeded 64.55 billion dollars expected by analysts. Earnings per share (EPS) amounted to 3.3 dollars, the highest figure in the history of statistical observations of the company. In turn, the social media conglomerate Meta Platforms Inc. demonstrated revenue growth to 40.59 billion dollars from 39.07 billion dollars in the previous quarter, while EPS were fixed at 6.03 dollars against expectations of 5.21 dollars. However, the engineering company Caterpillar Inc. reported a modest 16.1 billion dollars in revenue, below both the forecast of 16.37 billion dollars and 16.8 billion dollars over the same period a year earlier. EPS fell to 5.17 dollars compared to the 5.35 dollars estimate.
The bond market is growing: the rate on 10-year debt securities rose to 4.281% from 4.213%, on 20-year ones — to 4.597% from 4.569%, and on 30-year ones — to 4.478% from 4.469%.
The leaders of growth in the index are Verisk Analytics Inc. ( 4.54%), MongoDB ( 3.08%), Alphabet Inc. Class C ( 2.92%), Warner Bros Discovery Inc. ( 2.91%).
Among the leaders of decline are Super Micro Computer Inc. (˗32.68%), CDW Corp. (˗11.30%), AMD Inc. (˗10.62%).
Support and resistance
On the D1 chart, the index quotes continue to correct, remaining within the local channel with boundaries of 21500.0–19700.0.
Technical indicators have reversed around and are holding the signal to continue buying: fast EMAs on the Alligator indicator are moving away from the signal line, and the AO histogram is forming new correction bars, remaining in the purchases zone.
Support levels: 20100.0, 19150.0.
Resistance levels: 20600.0, 21400.0.

Trading tips
In case of continued growth and consolidation of the price above the level of 20600.0 one can open buy positions with a target of 21400.0. Stop loss — 20300.0. Implementation period: 7 days or more.
In case of a reversal and continuation of the corrective decline, as well as consolidation of the price below the support level of 20100.0, sell positions with a target of 19150.0 will be relevant. Stop loss — 20400.0.
风险提示:以上内容仅代表作者或嘉宾的观点,不代表 FOLLOWME 的任何观点及立场,且不代表 FOLLOWME 同意其说法或描述,也不构成任何投资建议。对于访问者根据 FOLLOWME 社区提供的信息所做出的一切行为,除非另有明确的书面承诺文件,否则本社区不承担任何形式的责任。
FOLLOWME 交易社区网址: www.followme.ceo


加载失败()