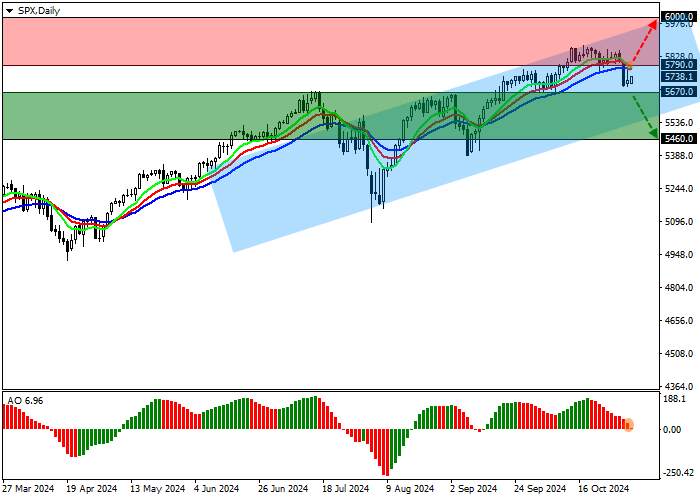
| Scenario | |
|---|---|
| Timeframe | Weekly |
| Recommendation | SELL STOP |
| Entry Point | 5670.0 |
| Take Profit | 5460.0 |
| Stop Loss | 5730.0 |
| Key Levels | 5460.0, 5670.0, 5790.0, 6000.0 |
| Alternative scenario | |
|---|---|
| Recommendation | BUY STOP |
| Entry Point | 5790.0 |
| Take Profit | 6000.0 |
| Stop Loss | 5700.0 |
| Key Levels | 5460.0, 5670.0, 5790.0, 6000.0 |
Current trend
The leading index of the American economy S&P 500 is correcting at 5738.0 amid the publication of corporate reports.
Oil major Exxon Mobil Corp. reported quarterly revenue of 90.02 billion dollars, down from 93.06 billion dollars in the prior quarter, while earnings per share fell to 1.92 dollars from 2.14 dollars after 2.25 dollars in the same period a year earlier. Meanwhile, energy company Chevron Corp. reported revenue of 50.67 billion dollars, down from 54.08 billion dollars in the same period a year earlier and 51.18 billion dollars in the previous quarter, while earnings per share fell to 2.51 dollars from 3.05 dollars last year and 2.55 dollars in the previous quarter.
The growth of yields in the bond market continues; however, today a local downward correction is observed: the rate on 10-year debt securities fell to 4.311% from 4.334%, and on 20-year ones it rose to 4.699% from 4.645%, while the yield on 30-year bonds reached 4.581%, which is the highest level since July 2.
The growth leaders in the index are Waters Corp. ( 19.84%), Charter Communications Inc. ( 11.87%), Intel Corp. ( 7.81%), Lululemon Athletica Inc. ( 7.81%).
Among the leaders of the decline are The AES Corp. (–10.79%), Super Micro Computer Inc. (–10.51%), Amcor Plc. (–7.82%).
Support and resistance
The index quotes are being adjusted, falling within the ascending channel with dynamic boundaries of 6000.0–5550.0.
Technical indicators are holding a buy signal, which has almost changed to a downward one: fast EMAs on the Alligator indicator are approaching the signal line, and the AO histogram, being in the buy zone, is forming descending bars.
Support levels: 5670.0, 5460.0.
Resistance levels: 5790.0, 6000.0.

Trading tips
If the asset continues declining and the price consolidates below 5670.0, short positions can be opened with the target at 5460.0. Stop-loss — 5730.0. Implementation time: 7 days and more.
If the asset continues to grow, as well as the price consolidates above the resistance level of 5790.0, long positions with a target of 6000.0 will be relevant. Stop-loss — 5700.0.
风险提示:以上内容仅代表作者或嘉宾的观点,不代表 FOLLOWME 的任何观点及立场,且不代表 FOLLOWME 同意其说法或描述,也不构成任何投资建议。对于访问者根据 FOLLOWME 社区提供的信息所做出的一切行为,除非另有明确的书面承诺文件,否则本社区不承担任何形式的责任。
FOLLOWME 交易社区网址: www.followme.ceo


加载失败()