| Scenario | |
|---|---|
| Timeframe | Weekly |
| Recommendation | BUY STOP |
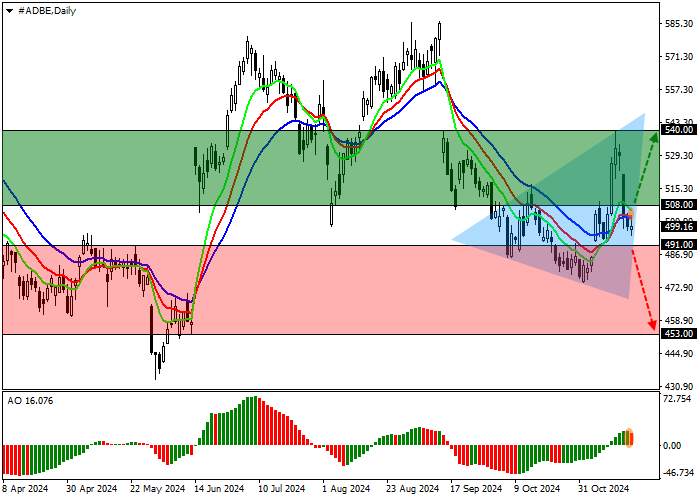
| Entry Point | 508.05 |
| Take Profit | 540.00 |
| Stop Loss | 500.00 |
| Key Levels | 453.00, 491.00, 508.00, 540.00 |
| Alternative scenario | |
|---|---|
| Recommendation | SELL STOP |
| Entry Point | 490.95 |
| Take Profit | 453.00 |
| Stop Loss | 510.00 |
| Key Levels | 453.00, 491.00, 508.00, 540.00 |
Current trend
Shares of Adobe Inc., a leading American software developer, are correcting downwards around 499.00.
Despite active business development and integration of innovative technologies into existing services, the company continues to experience financial difficulties, which was reflected in the corporate forecast for 2024 and caused concern among investors due to the likely decline in non-GAAP profit to 4.63–4.68 dollars, below the consensus estimate. Thus, the update for the Flagship solution for creative professionals Creative Cloud, presented at the Adobe MAX conference, which includes new features and flexible capabilities for working on different devices, publishing content, and mobile applications, did not cause experts to revise their estimates regarding the issuer’s competitiveness since monetization still seems insufficient to them against a lag behind other market participants who are actively introducing artificial intelligence-based options into their products. Nevertheless, Citi analysts confirmed the rating of Adobe Inc. shares at the neutral level, keeping the target at a high level of 616.0 dollars.
The quarterly financial report is due on December 11: revenue may amount to 5.54B dollars, higher than 5.41B dollars in the previous period and 5.05B dollars a year earlier, while profit per share is likely to be consolidated around 4.67 dollars, exceeding the previous 4.65 dollars and 4.27 dollars last year.
Support and resistance
On the daily chart, the asset is trading in a correction trend, trying to reverse within the Head and shoulders pattern with the Neckline at 540.00.
Technical indicators are holding the buy signal, which has been actively strengthening lately: fast EMAs on the Alligator indicator are above the signal line, and the AO oscillator histogram is trading in the positive zone, forming new correction bars.
Support levels: 491.00, 453.00.
Resistance levels: 508.00, 540.00.

Trading tips
Long positions should be opened after the price consolidates above the resistance level of 508.00, with the target at 540.00. Stop loss — 500.00. Implementation period: 7 days or more.
Short positions should be opened after the price consolidates below the support level of 491.00, with the target at 453.00 and stop loss 510.00.
风险提示:以上内容仅代表作者或嘉宾的观点,不代表 FOLLOWME 的任何观点及立场,且不代表 FOLLOWME 同意其说法或描述,也不构成任何投资建议。对于访问者根据 FOLLOWME 社区提供的信息所做出的一切行为,除非另有明确的书面承诺文件,否则本社区不承担任何形式的责任。
FOLLOWME 交易社区网址: www.followme.ceo


加载失败()