| Scenario | |
|---|---|
| Timeframe | Weekly |
| Recommendations | BUY STOP |
| Entry point | 34.6600 |
| Take Profit | 35.5000 |
| Stop Loss | 34.2000 |
| Key levels | 33.4000, 34.3000, 34.6600, 35.5000 |
| Alternative scenario | |
|---|---|
| Recommendations | SELL STOP |
| Entry point | 34.3000 |
| Take Profit | 33.4000 |
| Stop Loss | 34.6000 |
| Key levels | 33.4000, 34.3000, 34.6600, 35.5000 |
Current dynamics
During the morning session, the USD/TRY pair is trading at 34.5047 amid weak macroeconomic statistics from Turkey and a strengthening US dollar.
Thus, in November, the consumer confidence index fell from 80.6 points to 79.8 points for the first time since June, but the indicator has been in the “red” zone below 100.0 points for more than five years. In the third quarter, the area of buildings for which permits were issued for construction decreased by 18.9%, the number of permits for the construction of real estate - by 18.8%, and for apartments - by 17.0%, reflecting the negative trend in the sector.
In turn, the US dollar reached 107.00 in USDX yesterday as a result of positive data from the labor market: the number of initial applications for unemployment benefits amounted to 213.0 thousand, below 219.0 thousand a week earlier and forecasts of 220.0 thousand, as a result of which the average number of applications over the past four weeks decreased from 221.50 thousand to 217.75 thousand, and the total increased slightly from 1.872 million to 1.908 million.
Given the weak potential for recovery in the Turkish economy, the likelihood of the lira strengthening is minimal, and the trend towards strengthening of the USD/TRY pair will continue.
Support and resistance levels
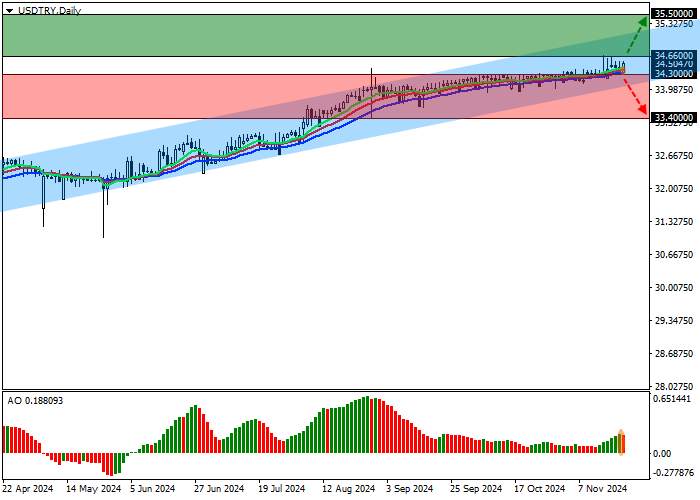
On the daily chart, an uptrend is forming and the trading instrument is moving above the key level of 34.3000 with a target at the trend resistance line of 35.5000.
Technical indicators strengthen the buy signal: the EMA oscillation range on the Alligator indicator expands upwards, and the AO histogram forms correction bars in the buy zone.
Resistance levels: 34.6600, 35.5000.
Support levels: 34.3000, 33.4000.

Trading scenarios
Long positions can be opened after the price rises and consolidates above 34.6600 with a target of 35.5000. Stop loss is 34.2000. Implementation period: 7 days or more.
Short positions can be opened after the price declines and consolidates below 34.3000 with a target of 33.4000. Stop loss is 34.6000.
风险提示:以上内容仅代表作者或嘉宾的观点,不代表 FOLLOWME 的任何观点及立场,且不代表 FOLLOWME 同意其说法或描述,也不构成任何投资建议。对于访问者根据 FOLLOWME 社区提供的信息所做出的一切行为,除非另有明确的书面承诺文件,否则本社区不承担任何形式的责任。
FOLLOWME 交易社区网址: www.followme.ceo


加载失败()