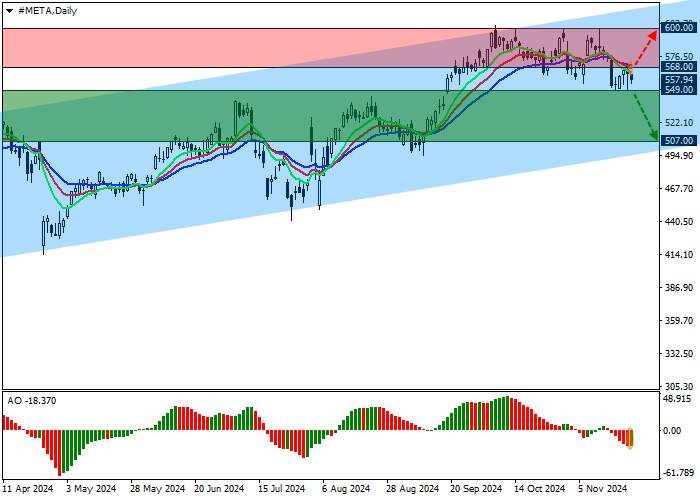
Shares of Meta Platforms Inc., an American transnational holding company that owns a technology conglomerate and the largest social network Facebook, are trading at 558.00.
On the daily chart, the price is forming a corrective trend, within which it is held in a wide ascending channel with dynamic boundaries of 620.00–500.00.
On the four-hour chart, the quotes reversed at the resistance line of 600.00. Despite holding above the summer high of 535.00, the probability of a decline is high, confirmed by a reversal Triple Top pattern formation at the support line of 550.00, near which the price is.
Technical indicators gave a sell signal: fast EMAs on the Alligator indicator are moving away from the signal line, and the AO histogram is forming correction bars in the sell zone.
Trading tips
Short positions may be opened after the price declines and consolidates below 549.00, with the target at 507.00. Stop loss – 555.00. Implementation period: 7 days or more.
Long positions may be opened after the price grows and consolidates above 568.00, with the target at 600.00. Stop loss – 560.00.


加载失败()