Technical analysis is a method of evaluating financial markets that involves analysing historical price movements, trading volume, and other statistical trends and then forecasting future movements.
How Technical Analysis Differs from Fundamental Analysis
Unlike fundamental analysis, which focuses on economic data, earnings reports, and company performance, technical analysis is based purely on price action and market behaviour. Traders use charts, indicators, and patterns to forecast potential price movements.
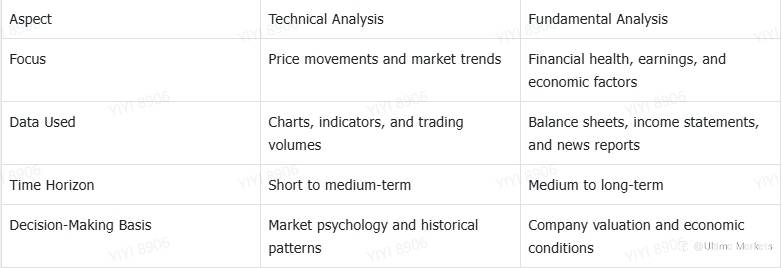
While fundamental analysis seeks to determine an asset's intrinsic value, technical analysis assumes that all known information is already reflected in the price, making patterns and trends the primary focus for traders.
Why Traders Rely on Technical Analysis
Technical analysis is widely used in forex, stocks, commodities, and cryptocurrency trading due to its ability to:
- Identify trends – Helps traders spot bullish and bearish market movements early.
- Provide entry and exit signals – Guides traders on when to buy or sell based on price patterns.
- Work across multiple timeframes – Useful for day traders, swing traders, and long-term investors.
- Quantify risk and reward – Helps set stop-loss and take-profit levels.
Limitations of Technical Analysis
Despite its popularity, technical analysis is not foolproof:
- False signals – Indicators and patterns can sometimes lead to misleading conclusions.
- No guarantee of future performance – Past price movements don’t always repeat.
- Highly subjective – Different traders may interpret the same chart in different ways.
Core Principles of Technical Analysis
Technical analysis is built on fundamental principles that guide traders in interpreting price movements and making informed decisions. These principles form the foundation of chart analysis, indicators, and trading strategies.
Price Discounts Everything
This is the most crucial assumption in technical analysis. The asset's price is already reflected in all available information—economic reports, earnings, political events, and even trader sentiment. As a result, there’s no need to analyse external factors separately.
Example:
If a stock trades at $100, technical analysts assume that the price already considers upcoming earnings, news, and market conditions. Instead of focusing on why the stock is priced at $100, they concentrate on whether it will move up or down based on historical price patterns.
Implication for Traders:
- Traders focus purely on price action rather than news or economic reports.
- Charts become the primary tool for decision-making.
Price Moves in Trends
Technical analysts believe prices move in trends rather than random fluctuations. Once a trend is established, the price is more likely to continue in that direction than to reverse.
Types of Market Trends:
- Uptrend (Bullish Market) – A series of higher highs and higher lows (e.g. a stock that consistently moves from $50 → $55 → $60).
- Downtrend (Bearish Market) – A series of lower highs and lower lows (e.g. a stock declining from $100 → $90 → $85).
- Sideways Trend (Range-Bound Market) – The price moves between a support and resistance level without a clear direction (e.g. a stock fluctuating between $30 and $35).
Traders widely use trend-following strategies, like Moving Averages and MACD. Traders also avoid going against the trend unless there is strong evidence of a reversal.
History Repeats Itself
Market movements are often driven by human emotions—fear, greed, optimism, and panic. Since human psychology does not change, price patterns and trends that worked in the past tend to reoccur.
Examples of Repeating Patterns:
- Double Top & Double Bottom – Indicate potential reversals.
- Head and Shoulders – A classic pattern used to predict trend reversals.
- Support and Resistance Levels – Traders rely on these historical levels for entry and exit points.
Studying past price patterns helps predict future movements. Traders can also rely on chart patterns to determine potential reversals or breakouts.
Market Psychology and Price Action
Traders’ emotions and reactions influence every price movement in the market. This psychological behaviour forms the basis of support, resistance, and trend reversals.
Key Psychological Levels:
- Round Numbers as Support/Resistance: Prices often stall at key psychological levels (e.g., $100, $50) because traders set their stop-losses and take-profit levels around them.
- Fear and Greed: During market rallies, greed pushes prices higher. In downturns, fear leads to panic selling.
- Volume Confirmation: A trend backed by high trading volume is stronger than one with low volume.
Combining price action with volume indicators provides a stronger analysis. Also, emotional discipline is essential to avoid impulsive decisions.
Candlestick Charts in Technical Analysis
Traders use different types of charts for technical analysis. However, the most popular chart is the candlestick pattern due to its visual clarity. Each candlestick represents a period’s open, high, low, and close (OHLC) prices.
Structure of a Candlestick:
- Bullish Candle (Green/White): The closing price is higher than the opening price.
- Bearish Candle (Red/Black): The closing price is lower than the opening price.
Common Candlestick Patterns
Candlestick patterns provide early signals of price movements. They can be classified into bullish reversal, bearish reversal, and continuation patterns.
A. Bullish Reversal Patterns (Indicate a potential price increase)
- Hammer – A small body with a long lower wick, signalling a reversal after a downtrend.
- Engulfing (Bullish) – A larger green candle fully engulfs the previous red candle, indicating strong buying pressure.
- Morning Star – A three-candle pattern showing a transition from bearish to bullish momentum.
B. Bearish Reversal Patterns (Indicate a potential price drop)
- Shooting Star – A small body with a long upper wick, indicating selling pressure.
- Engulfing (Bearish) – A large red candle completely engulfs the previous green candle, signalling a strong bearish momentum.
- Evening Star – A three-candle pattern showing a transition from bullish to bearish momentum.
C. Continuation Patterns (Indicate a temporary pause before continuing the trend)
- Doji – A candle with almost equal open and close prices, indicating indecision.
- Spinning Top – A candle with small real bodies and long wicks, showing uncertainty.
Chart Patterns and Their Significance
Chart patterns are larger formations that indicate trend reversals or continuations.
A. Reversal Patterns: Indicate a change in trend direction (bullish to bearish or vice versa).
- Head and Shoulders – A bearish pattern where the price forms three peaks, with the middle peak being the highest.
- Double Top – Two peaks at the same level, signalling resistance and a likely reversal downward.
- Double Bottom – Two troughs at the same level, indicating strong support and a likely price increase.
B. Continuation Patterns
Show a brief pause before the trend continues in the same direction.
- Flags & Pennants – Short consolidation phases that lead to a continuation of the previous trend.
- Triangles (Ascending, Descending, Symmetrical) – Indicate breakouts in the direction of the prevailing trend.
Essential Technical Indicators
Technical indicators are mathematical calculations based on price, volume, or open interest. They help traders analyse market conditions, identify trends, and generate trade signals. Indicators are categorised into trend indicators, momentum indicators, volatility indicators, and volume indicators.
Trend Indicators (Identify market direction)
Trend indicators help traders determine whether an asset is uptrend, downtrend, or moving sideways. They smooth price data to make trends more visible.
A. Moving Averages (SMA & EMA)
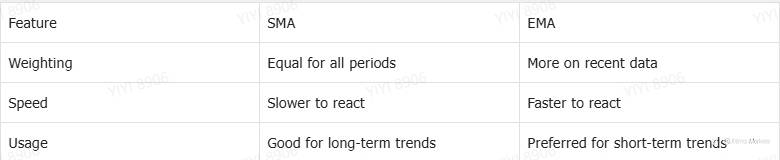
Moving averages (MAs) are technical indicators used in trading to smooth price data and identify trends. They help traders filter out short-term price fluctuations and focus on overall market direction. The two most common types are Simple Moving Averages (SMAs) and Exponential Moving Averages (EMAs).
1. Simple Moving Average (SMA): SMA calculates the average price of an asset over a set period by equally weighting all data points.
2. Exponential Moving Average (EMA): EMA weighs recent prices more heavily, making it more responsive to price changes.
How do Traders Use Moving Averages?
- Trend Identification: If the price is above the moving average, the trend is up; if below, the trend is down.
- Crossovers: A short-term MA crossing above a long-term MA (golden cross) signals a potential uptrend, while a crossing below (death cross) signals a downtrend.
- Support & Resistance: MAs often act as dynamic support or resistance levels.
B. Moving Average Convergence Divergence (MACD)
MACD is a momentum indicator that helps traders identify trend direction, strength, and potential reversals. It is based on the relationship between two Exponential Moving Averages (EMAs) and consists of three main components:
- MACD Line: The difference between the 12-day EMA and the 26-day EMA.
MACD = 12-day EMA−26-day EMA
- Signal Line: A 9-day EMA of the MACD line, which helps identify buy/sell signals.
- Histogram: The difference between the MACD and signal lines visually represents momentum.
Traders can confirm the trend with MACD: if MACD is above zero, the market is in an uptrend; if below, it’s in a downtrend. A widening MACD histogram also shows strong momentum, while a narrowing histogram signals weakening momentum. Further, extreme MACD readings may indicate that the market is overbought or oversold, signalling a potential reversal.
How Does MACD Work?
The workings of the MACD can be explained with three primary phenomena:
- MACD Crossovers: When the MACD line crosses above the signal line, it’s a bullish signal; however, when it crosses below the signal line, it’s a bearish signal.
- Zero Line Cross: If the MACD line moves above zero, it signals bullish momentum, while if it moves below zero, it signals bearish momentum.
- Divergence: Divergence can be either bullish or bearish. In the bullish divergence, the price makes lower lows, but MACD makes higher lows, indicating a potential upward trend reversal. The bearish divergence occurs when the price makes higher highs, but MACD makes lower highs, signalling a potential downtrend.
C. Average Directional Index (ADX)
The Average Directional Index (ADX) is a technical indicator that measures the strength of a trend, helping traders determine whether an asset is trending or ranging. It is part of the Directional Movement System, including the +DI (Positive Directional Indicator) and -DI (Negative Directional Indicator).
The ADX line measures the strength of a trend (values range from 0 to 100). The positive directional indicator indicates a bullish momentum, while the negative directional indicator shows a bearish momentum.
Some standard the ADX values are:
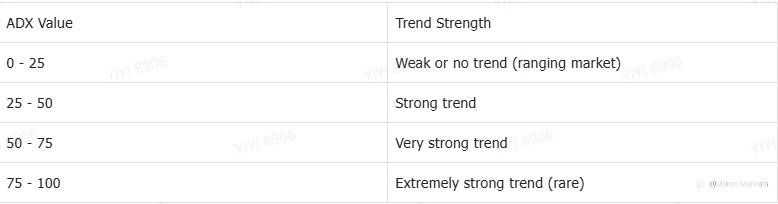
If the ADX value is above 25, the trend is gaining strength, while a value below 25 indicates the market is range-bound.
Momentum Indicators (Measure speed of price movement)
Momentum indicators help traders assess whether a trend has strong buying or selling pressure. Traders use many momentum indicators, but two of them are most popular: the Relative Strength Index (RSI) and the Stochastic Oscillator.
A. Relative Strength Index (RSI)
The Relative Strength Index (RSI) is a momentum oscillator that measures the speed and change of price movements. It helps traders identify overbought and oversold conditions, potential reversals, and trend strength. RSI value ranges between 0 to 100.
The RSI value depends upon Relative Strength (RS).
RS = Average of Upward Price Changes / Average of Downward Price Changes
RSI = 100 - (100/(1+RS))
Generally, an RSI value over 70 indicates that the market is overbought (indicating a potential reversal or pullback), while a value below 30 indicates that the market is oversold (suggesting a possible buying opportunity). 50 is the midpoint, indicating trend direction.
B. Stochastic Oscillator
The Stochastic Oscillator is a momentum indicator that measures the position of a security’s closing price relative to its price range over a given period. It helps traders identify overbought and oversold conditions, potential trend reversals, and entry/exit points. Its value ranges from 0 to 100 (above indicates overbought; below 20 signifies oversold).
The Stochastic Oscillator consists of two lines: %K line (fast stochastic) and %D line (slow stochastic). If the %K crosses above %D, it gives a buy signal with a bullish crossover, and if %K crosses below %D, it gives a sell signal with a bearish crossover.
Volatility Indicators (Measure price fluctuations)
Volatility indicators help traders assess how much an asset’s price fluctuates. Out of several volatility indicators, the popular ones are Bollinger Bands and Average True Range (ATR).
A. Bollinger Bands
Bollinger Bands are a technical analysis tool used to measure market volatility, identify overbought and oversold conditions, and detect potential trend reversals. They consist of three lines that adjust dynamically based on price movement: Middle Band (SMA), Upper Band, and Lower Band.
- Middle Band (SMA) → A 20-period Simple Moving Average (SMA)
- Upper Band → SMA + 2 standard deviations (measures overbought levels)
- Lower Band → SMA - 2 standard deviations (measures oversold levels)
The standard deviation in the Bollinger Bands measures volatility. When price volatility increases, the bands expand; when volatility decreases, the bands contract.
Further, if the price reaches the upper band, it may be overbought and due for a pullback. On the other hand, if the price touches the lower band, it may be oversold and due for a rebound.
When the bands contract tightly, it signals low volatility. A breakout is likely to occur, but direction is unknown. However, when the bands expand, it signals high volatility, and if the price moves strongly outside the band, a trend may be forming.
B. Average True Range (ATR): A Volatility Indicator
The Average True Range (ATR) is a technical indicator used to measure market volatility. It does not indicate trend direction but helps traders determine how much an asset typically moves within a given period. ATR is commonly used to set stop-loss levels, adjust position sizing, and identify high or low volatility conditions.
ATR increases when price volatility rises and decreases when price volatility falls. A higher ATR means bigger price swings, while a lower ATR means smaller price movements.
Volume Indicators (Confirm trend strength)
Volume indicators analyse the number of shares or contracts traded in a given period.
A. On-Balance Volume (OBV)
The On-Balance Volume (OBV) indicator is a momentum-based tool that measures buying and selling pressure by adding or subtracting volume based on price movement. It helps traders identify trends, confirm breakouts, and detect divergences between price and volume.
OBV can be interpreted in three ways:
- Confirming trend direction: A rising OBV and a rising price indicate strong buying pressure, confirming an uptrend. A falling OBV and a falling price indicate strong selling pressure, confirming a downtrend.
- OBV divergence (reversal signals): If the price makes lower lows, but OBV makes higher lows, then it indicates a possible upward trend reversal. On the other hand, if the price makes higher highs but OBV makes lower highs, then it indicates a possible downward trend reversal.
- OBV breakouts: If OBV breaks above resistance, it may signal strong buying momentum. In contrast, if OBV breaks below support, it may signal strong selling momentum.
B. Volume Profile
Volume Profile is a technical analysis tool that shows how much volume has been traded at different price levels rather than over time. Unlike traditional volume indicators that display volume per candle or time frame, Volume Profile helps traders identify key price levels where buying and selling activity is concentrated.
Volume Profile divides price levels into a histogram (bar chart) representing traded volume at each level. It helps traders identify support and resistance zones, fair value and imbalance, and breakout and reversal points.
Volume profiles can be categorised into three types:
- Fixed Range Volume Profile: It analyses a specific period (e.g., last 50 candles, a trading session, or a custom range) and helps traders spot trends, reversals, and breakout levels.
- Session Volume Profile: It shows volume distribution for a single trading session (daily, weekly, or monthly) and helps identify intraday support and resistance levels.
- Visible Range Volume Profile: It automatically updates based on visible price action on the chart and is best for dynamic analysis when scrolling through charts.
Traders can interpret volume profiles in three major ways:
- Using Point of Control (POC): It is a bullish signal if the price is above POC, while the price below the POC indicates a bearish signal. If the price is near POC, then it indicates a price consolidation.
- Using High & Low Volume Nodes: A High Volume Node (HVN) signals that the price might stall due to strong buyer/seller activity. In contrast, a Low Volume Node (LVN) indicates quick price movement through these zones, acting as breakout areas.
- Using Value Area (VA): If the price moves above the Value Area, it signals a bullish breakout, while If the price moves below the Value Area, it signals a bearish breakdown. In a balanced market, the price stays within this Value Area.
Support and Resistance
Support and resistance are key concepts in technical analysis. They help traders identify entry and exit points by marking price levels where buying or selling pressure is historically strong. Understanding these levels improves trade timing and risk management.
What is Support?
Support is a price level where buying interest is strong enough to prevent the price from falling further. It acts as a floor that the price struggles to break below.
Support forms at a price level where strong demand often leads to price rebounds. A break below support can signal a downtrend. Traders usually buy near support in an uptrend and set stop-loss orders below support to manage risk.
What is Resistance?
Resistance is a price level where selling pressure is strong enough to prevent further price increases. It acts as a ceiling that the price struggles to break above.
Resistance forms at a level where supply overcomes demand and often leads to price pullback. A breakout above resistance can signal an uptrend. Traders sell near resistance in a downtrend and set take-profit targets at resistance levels.
Fibonacci Retracements and Extensions
Fibonacci retracements and extensions are powerful tools in technical analysis that help traders identify potential support, resistance, and price targets. Based on the Fibonacci sequence, these levels are widely used to predict market movements in forex, stocks, and cryptocurrency trading.
The Fibonacci sequence (1, 1, 2, 3, 5, 8, 13, 21…) forms the basis of Fibonacci retracement and extension levels. The key ratios derived from this sequence are:
- Retracement Levels: 23.6%, 38.2%, 50%, 61.8%, 78.6%
- Extension Levels: 127.2%, 161.8%, 200%, 261.8%, 423.6%
These levels act as key price zones where the market may reverse or continue in the trend's direction.
What is Fibonacci Retracement?
Fibonacci retracement is used to identify potential support and resistance levels when the price retraces before continuing in the trend direction.
Traders must find a strong trend (uptrend or downtrend) and use the Fibonacci tool to draw from the swing low to swing high (for uptrends) or swing high to swing low (for downtrends). The retracement levels indicate potential pullback areas.
Key retracement levels:
- 23.6% – Minor pullback, strong trend continuation.
- 38.2% – Shallow retracement, moderate trend continuation.
- 50% – Common pullback level (not an official Fibonacci ratio).
- 61.8% – Golden Ratio, strongest support/resistance level.
- 78.6% – Deep retracement, trend reversal possible.
What is the Fibonacci Extension?
Fibonacci extensions help traders predict price targets after a retracement is completed. They indicate potential breakout targets or profit-taking zones.
Traders must identify a trend move, wait for a retracement, and then use Fibonacci extension levels to project the next price target.
Key extension levels:
- 127.2% – First breakout target.
- 161.8% – Strong continuation level, often used for take-profit.
- 200% – Major trend extension target.
- 261.8% & 423.6% – Extreme extensions, used in strong trends.
There are many other technical analysis tools and strategies for traders. The key is to find some specific tools and strategies and use them in trading.
Trade with Ultima Markets
Ultima Markets is a fully licensed broker and a multi-asset trading platform offering access to
250+ CFD financial instruments, including Forex, Commodities, Indices and Shares. We
guarantee tight spreads and fast execution. Until now, we have served clients from 172
countries and regions with our trustworthy services and well-built trading systems.
Ultima Markets has achieved remarkable recognition in 2024, winning prestigious awards
such as the Best Affiliates Brokerage, Best Fund Safety in Global Forex Awards, and
the Best APAC CFD broker in Traders Fair 2024 Hong Kong. As the first CFD broker to join
the United Nations Global Compact, Ultima Markets underscores its commitment to
sustainability and the mission to advance ethical financial services and contribute to a
sustainable future.
Ultima Markets is a member of The Financial Commission, an international independent
body responsible for resolving disputes in the Forex and CFD markets.
All clients of Ultima Markets are protected under insurance coverage provided by Willis
Towers Watson (WTW), a global insurance brokerage established in 1828, with claims
eligibility up to US$1,000,000 per account.
Open an account with Ultima Markets to start your index CFDs trading journey.
风险提示:以上内容仅代表作者或嘉宾的观点,不代表 FOLLOWME 的任何观点及立场,且不代表 FOLLOWME 同意其说法或描述,也不构成任何投资建议。对于访问者根据 FOLLOWME 社区提供的信息所做出的一切行为,除非另有明确的书面承诺文件,否则本社区不承担任何形式的责任。
FOLLOWME 交易社区网址: www.followme.ceo


加载失败()