- AUD/NZD was seen trading near the 1.0840 zone, mildly recovering after earlier losses
- The pair maintains a strong bearish outlook, trading below all major moving averages
- Momentum indicators suggest continued downside, though RSI signals nearing oversold conditions
The AUD/NZD pair continues to reflect bearish dynamics on Monday’s session , with price action hovering near the 1.0800 region. Despite a modest rebound, the broader technical structure remains tilted to the downside.
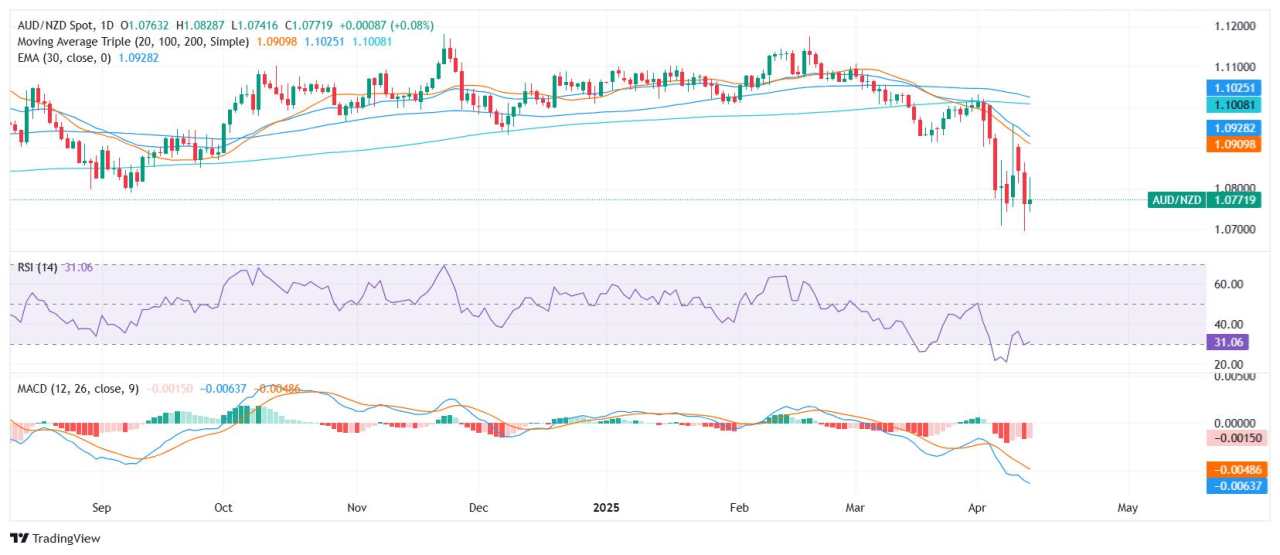
The pair is firmly capped by all major moving averages — both simple and exponential — from short to long-term periods. Notably, the 10-day EMA at 1.08495, 50-day EMA at 1.09701, and 100-day SMA at 1.10280 all point south, while the 200-day SMA at 1.10080 reinforces the longer-term bearish bias. Price has failed to break above any of these key averages, confirming sustained downside pressure.
Momentum indicators are aligned with the bearish theme. The MACD continues to print red bars, while the Momentum oscillator at −0.02370 also suggests weak buying interest. Meanwhile, the RSI sits at 33.10 approaching oversold territory, which may slow the pace of losses but does not yet support a reversal.
Support is seen at 1.0800 and 1.0765, with deeper losses eyeing the 1.0720 zone. Resistance levels are stacked at 1.0850, 1.0900, and 1.0970 (50-day EMA). For now, the technical landscape favors sellers while the pair remains suppressed below these moving averages.
Daily chart
作者:Patricio Martín,文章来源FXStreet,版权归原作者所有,如有侵权请联系本人删除。
风险提示:以上内容仅代表作者或嘉宾的观点,不代表 FOLLOWME 的任何观点及立场,且不代表 FOLLOWME 同意其说法或描述,也不构成任何投资建议。对于访问者根据 FOLLOWME 社区提供的信息所做出的一切行为,除非另有明确的书面承诺文件,否则本社区不承担任何形式的责任。
FOLLOWME 交易社区网址: www.followme.ceo


加载失败()