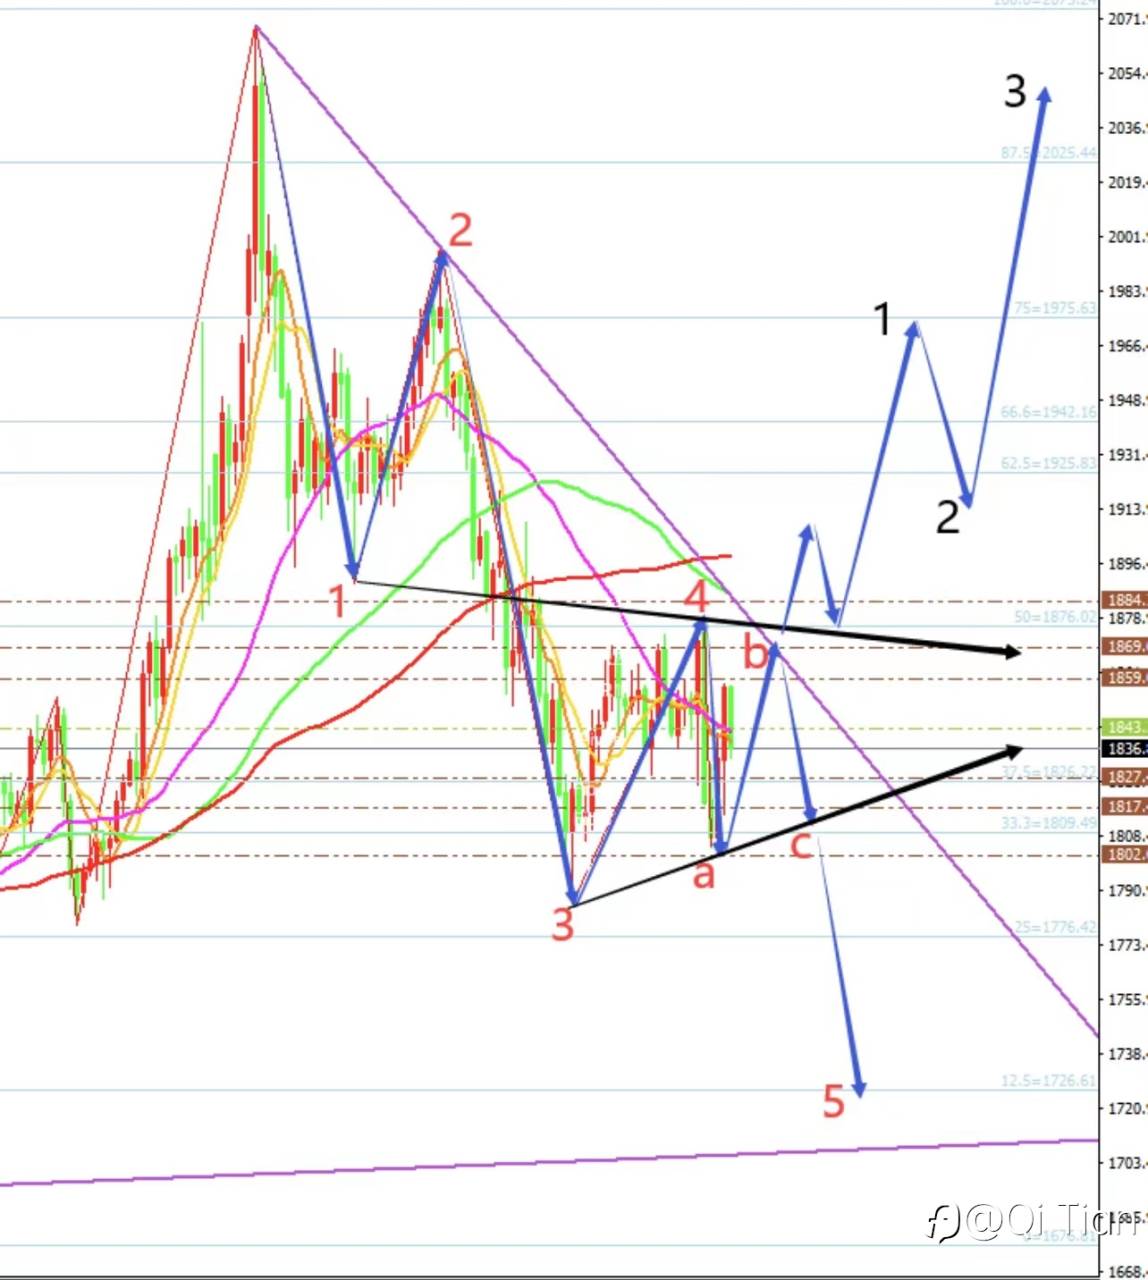
The price of gold showed a call back in pricing, ending with shocks around the 1842/1835 range, and the daily chart closed at positive chart. At present, the daily moving average system MA10/7 is flat, and the RSI indicator is still below the central axis. From the perspective of the daily line, the probability of continuing to fluctuate is high, and there is no clear direction and trend. The short-term four-hour chart and the hourly chart of the moving average re-condensed and glued together, and the RSI indicator returned to the central axis, making it clear that the price was in the upper line of the triangle finishing range to see 1845/48 for suppression, and the lower line of the triangle to see 1828/1825 for support.
Today’s trading protocol is to sell at high and buy at low, but still see wide fluctuations. The upper resistance is 1848/1856/1868/1878, and the lower support is 1832/1828/1820/1808.

风险提示:以上内容仅代表作者或嘉宾的观点,不代表 FOLLOWME 的任何观点及立场,且不代表 FOLLOWME 同意其说法或描述,也不构成任何投资建议。对于访问者根据 FOLLOWME 社区提供的信息所做出的一切行为,除非另有明确的书面承诺文件,否则本社区不承担任何形式的责任。
FOLLOWME 交易社区网址: www.followme.ceo


加载失败()